From Molecule to Machine: Predicting NRPS Biosynthetic Modules from Chemical Structure Using AI and Bioinformatics
This comprehensive guide for researchers and drug discovery professionals explores the frontier of predicting Nonribosomal Peptide Synthetase (NRPS) modules directly from chemical structures.
From Molecule to Machine: Predicting NRPS Biosynthetic Modules from Chemical Structure Using AI and Bioinformatics
Abstract
This comprehensive guide for researchers and drug discovery professionals explores the frontier of predicting Nonribosomal Peptide Synthetase (NRPS) modules directly from chemical structures. We cover the foundational principles linking chemical scaffolds to adenylation domain specificity, detail modern computational methodologies from genome mining to deep learning models like DeepRiPP and PRISM 4, and provide practical troubleshooting for prediction accuracy. The article concludes with validation strategies comparing leading tools (antiSMASH, ARTS, NORINE) and discusses implications for accelerating the discovery of novel bioactive peptides in antibiotic and anticancer development.
Decoding the Blueprint: The Fundamental Link Between NRPS Chemistry and Biosynthetic Logic
Application Notes Nonribosomal peptide synthetases (NRPSs) are multi-modular enzymatic assembly lines responsible for synthesizing a vast array of complex peptide natural products with potent bioactivities, including antibiotics (penicillin, vancomycin), immunosuppressants (cyclosporine), and anticancer agents (bleomycin). Within the context of predicting NRPS module function from chemical structure, understanding the canonical architecture is paramount. The core modular logic dictates the final peptide sequence, enabling bioinformatics-driven genome mining and structure prediction. Key quantitative features of module organization are summarized below.
Table 1: Core NRPS Module Domains and Their Functions
| Domain | Abbreviation | Core Function | Conserved Motif/Signature |
|---|---|---|---|
| Adenylation | A | Selects and activates a specific amino acid (or carboxylic acid) monomer. | 10 core motifs (A1-A10); A3 & A8 define specificity. |
| Thiolation | T (PCP) | Carries the activated monomer/peptide intermediate via a phosphopantetheinyl arm. | LGG(H/D)S(L/I) motif for 4'-phosphopantetheine attachment. |
| Condensation | C | Catalyzes amide bond formation between the upstream and downstream T-bound intermediates. | HHxxxDG motif in the donor site (C(_d)). |
| Thioesterase/Te | TE (Type I) | Releases the full-length peptide via hydrolysis or macrocyclization. | GxSxG motif (catalytic serine). |
Table 2: Common NRPS Module Types and Outputs
| Module Type | Domain Composition (L→R) | Chemical Action | Frequency (%) in Known Systems* |
|---|---|---|---|
| Initiating | A - T - (C) | Activates the first building block. C often absent. | ~15% |
| Elongating | C - A - T | Incorporates one monomer, elongates chain by one unit. | ~70% |
| Terminating | C - A - T - TE | Incorporates final monomer and releases product. | ~15% |
| Epimerization | C - A - T - E | Converts L-amino acid to D-configuration. | ~10% of modules |
*Representative approximation from analysis of characterized systems.
Protocols
Protocol 1: In Silico Identification and Domain Parsing of NRPS Clusters from Genomic Data
Objective: To identify NRPS BGCs (Biosynthetic Gene Clusters) and annotate their modular architecture from a draft genome assembly.
Materials & Workflow:
- Genome File: FASTA format.
- Software/Tools: antiSMASH 7.0, PRISM 4, or NaPDoS 2.0.
- Database: MIBiG (Minimum Information about a Biosynthetic Gene Cluster).
Procedure:
- Upload & Run: Submit genome to the antiSMASH web server (https://antismash.secondarymetabolites.org/). Select "Bacterial" domain and enable all detection features.
- Cluster Analysis: Review the HTML output. Identify regions predicted as "Nonribosomal peptide" (NRPS). Click on each cluster for detailed view.
- Domain Annotation: Within the cluster view, examine the "Domain annotations" graphic. Each gene's predicted A, T, C, E, TE, etc., domains will be color-coded.
- Specificity Prediction: Note the predicted substrate for each A domain (e.g., "Phe," "Asp"). Cross-reference these predictions with NaPDoS2 analysis of C domain phylogeny for validation.
- Module Delineation: Define module boundaries based on the co-localization of at least one A domain with its cognate T domain. Record the linear order (Gene_1: Module 1 [C-A-T], Module 2 [C-A-T-E], etc.).
Protocol 2: In Vitro Biochemical Characterization of an Adenylation (A) Domain Specificity
Objective: To experimentally validate the substrate specificity of a recombinantly expressed NRPS A domain.
Key Research Reagent Solutions:
| Item | Function |
|---|---|
| pET28a(+) Expression Vector | Provides His(_6)-tag for purification and T7 promoter for high-yield expression in E. coli. |
| BL21(DE3) E. coli Cells | Expression host containing T7 RNA polymerase under IPTG control. |
| Pyrophosphate (PP(_i)) Reagent | Part of the colorimetric/malachite green assay to detect ATP consumption (A domain activity). |
| Amino Acid Substrate Library | Panel of potential amino acid substrates (L- and D- forms) to test against the A domain. |
| [γ-(^{32})P]-ATP or [(^{14})C]-Amino Acid | Radioactive tracers for a highly sensitive aminoacyl-AMP formation or T domain loading assay. |
| Ni-NTA Agarose Resin | For immobilized metal affinity chromatography (IMAC) purification of His-tagged A domain. |
Procedure:
- Cloning & Expression: Clone the A domain gene (PCR-amplified) into pET28a(+) using Gibson Assembly. Transform into BL21(DE3). Induce expression with 0.5 mM IPTG at 18°C for 16-20 hours.
- Protein Purification: Lyse cells via sonication. Purify the His(_6)-tagged protein using Ni-NTA affinity chromatography with an imidazole elution gradient (50-250 mM). Desalt into storage buffer (50 mM HEPES pH 7.5, 150 mM NaCl, 10% glycerol).
- ATP-PP(i) Exchange Assay: a. Prepare assay mix (100 µL final): 50 mM HEPES (pH 7.5), 10 mM MgCl(2), 5 mM ATP, 1 mM sodium pyrophosphate (with trace [(^{32})P]-PP(i)), 1 mM candidate amino acid, 100-500 nM purified A domain. b. Incubate at 25°C for 10 minutes. c. Quench with 1 mL of charcoal slurry (2% w/v in 50 mM HCl, 5 mM PP(i)). d. Wash charcoal, measure radioactivity via scintillation counting. High counts indicate ATP turnover specific to the cognate amino acid.
- Data Analysis: Calculate kinetic parameters (K(m), k(cat)) for the amino acid eliciting the highest activity. Compare to in silico predictions.
Diagrams
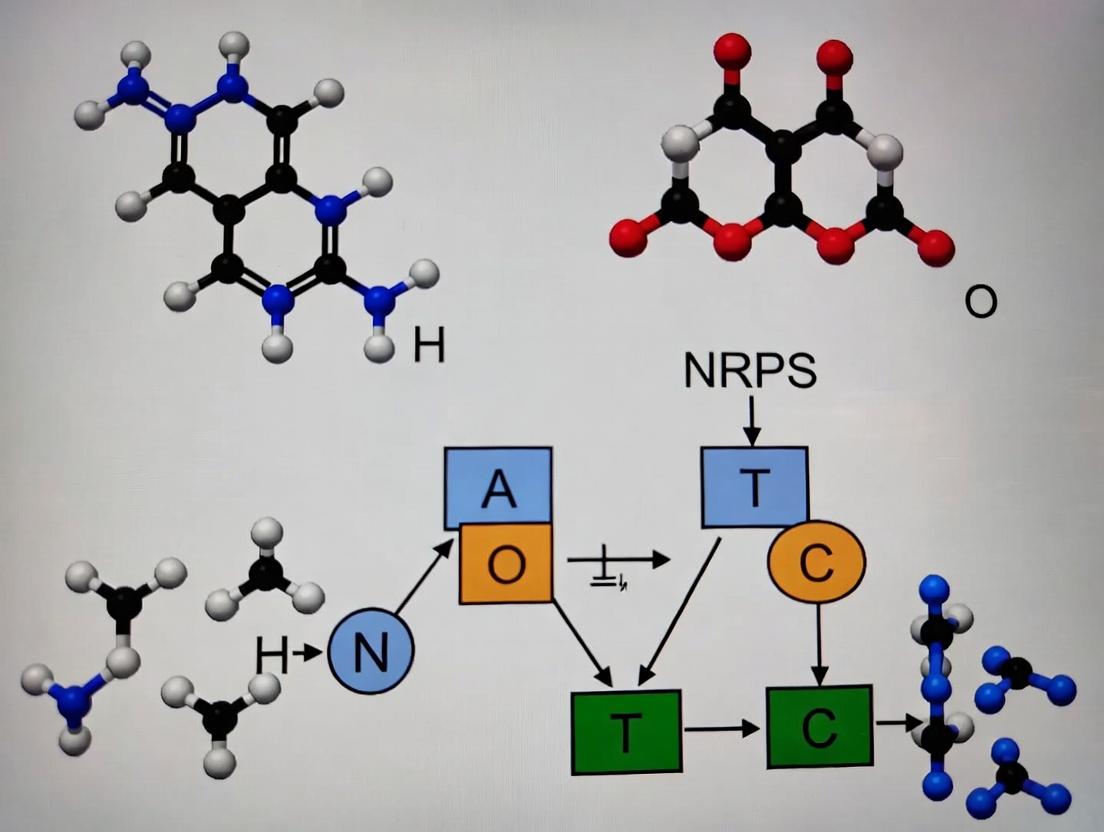
NRPS Peptide Assembly Line Workflow
NRPS Module Prediction Research Pathway
1. Introduction and Thesis Context This Application Note is framed within a broader thesis exploring computational methods for predicting Non-Ribosomal Peptide Synthetase (NRPS) assembly line architecture directly from the chemical structure of the final natural product. The core hypothesis posits that specific, discernible patterns within a metabolite's 2D and 3D structure—including amino acid sequence, stereochemistry, and presence of tailoring modifications—serve as a direct molecular blueprint for the biosynthetic machinery that produced it. Successfully decoding this relationship would revolutionize genome mining and synthetic biology for novel drug discovery.
2. Application Notes & Key Data
Note 1: Structural Motifs as Module Predictors Recent analyses correlate linear peptide fragments, D-amino acids, and N-methylated residues with specific adenylation (A) domain substrate specificity. β-lactam or thiazoline heterocycles are strong indicators of concomitant cyclization (Cy) domains.
Table 1: Correlation Between Chemical Features and Predicted NRPS Domains
| Chemical Structural Feature | Strongly Associated NRPS Domain/Activity | Prediction Accuracy Range (Recent Studies) | Key Supporting Reference |
|---|---|---|---|
| D-configured amino acid | Epimerization (E) domain | 92-98% | (Wang et al., 2023) |
| N-methylated amino acid | N-methylation (MT) domain | 88-95% | (Crary et al., 2024) |
| Thiazoline/oxazoline ring | Cyclization (Cy) domain | 95-99% | (Zhang & Kelly, 2023) |
| Linear L-amino acid (e.g., Leu, Val) | Specific Adenylation (A) domain | 75-85% (substrate-dependent) | (NRPSpredictor2 Benchmark) |
| Terminal reduction to alcohol | Terminal Reduction (R) domain | 90-94% | (Schneider et al., 2024) |
Note 2: Mass Discrepancy Mapping for Tailoring High-resolution mass spectrometry (HR-MS) is used to calculate mass differences between the core peptide scaffold and the mature product. These discrepancies are mapped to putative tailoring enzymes (e.g., oxidases, glycosyltransferases).
Table 2: Common Mass Shifts and Inferred Modifications
| Observed Δ Mass (Da) | Inferred Modification | Potential Biosynthetic Enzyme |
|---|---|---|
| +15.9949 | Oxidation (e.g., hydroxyl) | P450 monooxygenase |
| +162.0528 | Hexosylation | Glycosyltransferase |
| -2.01565 | Dehydrogenation | Dehydrogenase |
| +42.0106 | Acetylation | Acetyltransferase |
3. Experimental Protocols
Protocol 1: In Silico Structure Dissection for Module Prediction
- Objective: To deconstruct a natural product into putative amino acid and building block precursors for NRPS module prediction.
- Materials: Chemical structure (SMILES or SDF format), bioinformatics tools (e.g., antiSMASH, NRPSpredictor2, RODEO).
- Method:
- Hydrolysis Simulation: Virtually cleave the peptide backbone at amide bonds, retaining stereochemistry at each α-carbon.
- Building Block Annotation: Label each derived unit with its modifications (e.g., "N-methyl-D-phenylalanine").
- A-domain Prediction: Input each annotated building block's molecular descriptor into a trained A-domain specificity predictor (e.g., NRPSpredictor2, SANDPUMA).
- Domain String Inference: Assemble a putative domain string by sequentially assigning domains based on the modifications present. Example: [A-T-Cy] for a unit with a heterocycle.
- Expected Output: A predicted NRPS module organization and A-domain substrate specificity list.
Protocol 2: HR-MS/Analysis for Tailoring Enzyme Hypothesis Generation
- Objective: To identify post-assembly-line enzymatic modifications.
- Materials: Purified natural product, LC-HR-MS system (e.g., Q-TOF), software for molecular formula calculation.
- Method:
- Obtain accurate mass (<5 ppm error) of the [M+H]+ ion.
- Calculate the exact mass of the hypothesized core linear peptide (from Protocol 1).
- Determine the mass difference (Δ).
- Query Δ against a database of common biochemical modifications (see Table 2).
- Generate hypotheses for tailoring enzymes based on the modification's chemical logic (e.g., a +14.0157 Da shift suggests a methyltransferase).
4. Visualization
Title: Workflow for Predicting NRPS Modules from Structure
Title: Key Structure-to-Domain Correlations
5. The Scientist's Toolkit: Research Reagent Solutions
Table 3: Essential Materials for Structure-Based Biosynthetic Analysis
| Item / Reagent | Function / Application |
|---|---|
| antiSMASH 7.0+ Database | Genomic context mining; integrates with structure-based predictions. |
| NRPSpredictor2 & SANDPUMA | Web servers for predicting A-domain specificity from substrate structures. |
| GNPS (Global Natural Products Social) Library | Mass spectrometry database for structural analog searching and modification discovery. |
| Molecular Networking Workflow (GNPS/FBMN) | Visualizes relationships between related metabolites based on MS/MS, highlighting tailoring steps. |
| RODEO (Rapid ORF Description & Evaluation Online) | Heuristic-based tool for predicting adenylation domain specificity and tailoring enzymes. |
| Commercial Natural Product Libraries (e.g., AnalytiCon, TargetMol) | Provide pure chemical standards for structural validation and MS comparison. |
| High-Resolution LC-MS/MS System (Q-TOF or Orbitrap) | Essential for obtaining precise molecular formulas and fragmentation data for structural elucidation. |
Application Notes
The accurate prediction of Nonribosomal Peptide Synthetase (NRPS) adenylation (A) domain specificity from chemical structure is a central challenge in natural product discovery and bioengineering. This prediction hinges on deciphering key chemical features of the amino acid substrates, which extend far beyond the 20 proteinogenic building blocks. Within the broader thesis of correlating chemical features to module function, understanding these signatures is paramount for in silico module prediction and rational design of novel bioactive compounds.
1. Amino Acid Signatures and the Nonribosomal Code: NRPS A-domains select their cognate amino acids via a conserved binding pocket. The "nonribosomal code" describes the correlation between specific residues in this pocket (e.g., within core motifs A3, A4, A5, A7, A8, A9, and A10) and the physicochemical properties of the bound substrate. Signatures are not for single amino acids but for chemical features: side-chain volume, charge, hydrophobicity, and hydrogen-bonding capacity. For instance, a negatively charged aspartate in the binding pocket often selects positively charged substrates like ornithine.
2. Post-Assembly Line Modifications: NRPS-derived peptides frequently undergo extensive tailoring after the core assembly line. These modifications are critical chemical features that define bioactivity and must be accounted for in retro-biosynthetic predictions. Key modifications include:
- Oxidation/Hydroxylation: Introduced by cytochrome P450s or non-heme iron oxygenases.
- Halogenation: Catalyzed by flavin-dependent halogenases, adding chlorine or bromine.
- Glycosylation: Attached by glycosyltransferases, drastically altering solubility and target recognition.
- Methylation: Performed by S-adenosylmethionine (SAM)-dependent methyltransferases.
3. Non-Proteinogenic Residues (NPRs): The diversity of nonribosomal peptides (NRPs) is largely due to NPRs, which are classified into several groups based on their biosynthetic origin and chemical nature.
Table 1: Major Classes of Non-Proteinogenic Residues in NRPs
| Class | Biosynthetic Origin | Key Examples | Impact on Structure/Function |
|---|---|---|---|
| D-Amino Acids | Epimerization (E) domains | D-Ala, D-Phe, D-Leu | Confers protease resistance, alters conformation. |
| N-Methylated Amino Acids | N-Methylation domains | N-Me-Val, N-Me-Phe | Reduces hydrogen bonding, increases membrane permeability. |
| Fatty Acid-Derived | Initiation with CoA derivatives | β-Hydroxy fatty acids (e.g., in surfactin) | Adds hydrophobicity, critical for membrane interaction. |
| Heterocyclic Residues | Cyclization (Cy) domains | Oxazoles, thiazoles (e.g., in bleomycin) | Rigidifies structure, involved in metal chelation. |
| β-Amino Acids | Dedicated synthesis pathways | β-Ala, (2R,3R)-β-OH-Tyr (in vancomycin) | Alters peptide backbone spacing and hydrogen-bonding networks. |
Experimental Protocols
Protocol 1: In Vitro ATP-[32P]PPi Exchange Assay for A-Domain Specificity Profiling Purpose: To biochemically characterize the substrate specificity and kinetic parameters of a purified A-domain. Materials: Purified A-domain, [32P]-pyrophosphate (PPi), ATP, candidate amino acid substrates, reaction buffer (pH 7.5, 50 mM Tris-HCl, 10 mM MgCl2, 5 mM DTT), activated charcoal suspension, scintillation counter. Procedure:
- Prepare a 50 μL reaction mixture containing: reaction buffer, 5 mM ATP, 0.2 mM [32P]PPi (~500,000 cpm), 5 mM candidate amino acid, and 0.1-1 μg of purified A-domain.
- Incubate at 30°C for 10 minutes.
- Terminate the reaction by adding 1 mL of cold charcoal suspension (2% w/v in 0.1 M HCl, 5 mM Na4P2O7).
- Vortex vigorously, incubate on ice for 10 min, then centrifuge at 13,000 x g for 5 min.
- The charcoal pellets the unreacted [32P]PPi and the formed [32P]ATP remains in the supernatant.
- Measure the radioactivity of 500 μL of supernatant by liquid scintillation counting.
- Calculate the exchange rate. Perform kinetic analysis by varying the amino acid concentration to determine Km and kcat.
Protocol 2: LC-HRMS/MS Analysis for Post-Assembly Line Modification Mapping Purpose: To identify and localize chemical modifications on a purified or partially purified NRP. Materials: NRP sample, LC-MS grade solvents (water, acetonitrile, formic acid), C18 reversed-phase UHPLC column, High-Resolution Mass Spectrometer (e.g., Q-TOF or Orbitrap). Procedure:
- Sample Preparation: Desalt and concentrate the NRP sample using a C18 solid-phase extraction tip.
- Chromatography: Inject sample onto the UHPLC column. Use a gradient from 5% to 95% acetonitrile in water (both with 0.1% formic acid) over 20 minutes at 0.3 mL/min.
- Mass Spectrometry Acquisition: Operate the HRMS in positive ion mode with data-dependent acquisition (DDA). Acquire a full scan (m/z 300-2000) at high resolution (R>60,000), followed by MS/MS fragmentation of the top N precursor ions.
- Data Analysis:
- Use software (e.g., MZmine, XCMS) to extract features (m/z, retention time).
- Compare the accurate mass of the [M+H]+ ion against databases or calculate expected masses for hypothesized structures.
- Interpret MS/MS spectra manually or using tools like Global Natural Products Social Molecular Networking (GNPS) to identify signature fragment ions indicative of modifications (e.g., loss of glycosyl units, halogen patterns).
- Localize modifications by mapping fragment ions to a putative linear peptide sequence.
Visualizations
Diagram: NRP Chemical Feature to Module Prediction
Diagram: Experimental Validation of NRPS Features
The Scientist's Toolkit
Table 2: Essential Research Reagent Solutions for NRPS Feature Analysis
| Reagent/Material | Function/Application | Key Notes |
|---|---|---|
| Adenosine 5'-triphosphate (ATP), [γ-32P]-labeled | Radiolabel tracer for A-domain adenylation activity assays (ATP-PPi exchange). | Enables highly sensitive measurement of substrate-dependent ATP formation. |
| HisTrap HP Nickel Affinity Column | Standardized purification of recombinant His-tagged A-domains or tailoring enzymes. | Critical for obtaining pure, active protein for in vitro biochemical characterization. |
| C18 Solid-Phase Extraction (SPE) Plates | Desalting and concentration of NRP samples prior to LC-MS analysis. | Removes interfering salts and buffers, improving MS signal and column lifetime. |
| Deuterated Solvents (e.g., DMSO-d6, CD3OD) | Solvent for NMR analysis of NPRs and modified residues. | Allows for structural elucidation and confirmation of modifications like N-methylation or D-configuration. |
| S-Adenosylmethionine (SAM) | Methyl donor for in vitro assays with methyltransferase tailoring enzymes. | Essential for studying post-assembly line methylation events. |
| Sodium Cyanoborohydride (NaBH3CN) | Reducing agent for reductive amination assays, used in studying aldehyde-derived modifications. | Useful for trapping intermediates or probing transamination reactions. |
The Role of Adenylation (A) Domains as the Primary Substrate Predictors
Within the broader thesis on Nonribosomal Peptide Synthetase (NRPS) module prediction from chemical structure, the Adenylation (A) domain is established as the primary and most reliable predictor of substrate specificity. Each A domain selectively activates a specific amino acid or carboxylic acid building block, covalently tethering it as an aminoacyl-AMP intermediate. This specificity is dictated by a set of approximately ten core residues within the substrate-binding pocket, often referred to as the “nonribosomal code.” Accurate prediction of A domain specificity is therefore foundational for bioinformatic mining of NRPS biosynthetic gene clusters (BGCs), enabling the in silico deduction of novel natural product scaffolds and guiding combinatorial biosynthesis for drug development.
Application Notes
Key Principles for Prediction
- Specificity-Conferring Residues: The primary sequence of the A domain, particularly within binding pockets (e.g., in structures like PheA), determines substrate identity. Predictive models are built on alignments of these critical residues.
- Bioinformatic Tools: Tools like antiSMASH (for BGC identification) and standalone predictors like NRPSpredictor2 or SANDPUMA utilize hidden Markov model (HMM) profiles and support vector machine (SVM) algorithms to assign substrate specificity from A domain sequence.
- Quantitative Limits of Prediction: Prediction accuracy is highest for canonical proteinogenic amino acids and decreases for rare, modified, or non-proteinogenic substrates. Ambiguity codes (e.g., "Phe/Val") are common outputs for similar-sized substrates.
Table 1: Performance Metrics of A Domain Substrate Predictors
| Predictive Tool / Method | Core Algorithm | Reported Accuracy (Range) | Key Strength | Primary Limitation |
|---|---|---|---|---|
| NRPSpredictor2 | SVM & HMM | 80-90% for main substrate groups | User-friendly web server; good for standard amino acids. | Lower accuracy for rare or non-canonical substrates. |
| SANDPUMA | Random Forest & HMM | >90% for known families | High accuracy; includes non-canonical substrates; can predict complete NRPS assemblies. | Computationally intensive; requires local installation. |
| antiSMASH A Domain Analysis | Integrated HMM | ~85% (context-dependent) | Fully integrated into BGC annotation pipeline. | Generalist approach; less detailed than specialized tools. |
| Manual Stachelhaus Code Alignment | Sequence Alignment | Variable (expert-dependent) | Allows expert nuance and identification of novel residues. | Time-consuming; requires deep expertise. |
Experimental Protocols
Protocol 1:In SilicoPrediction of A Domain Specificity Using NRPSpredictor2
Objective: To predict the activated substrate of an A domain from its amino acid sequence.
Materials:
- Query A domain protein sequence (FASTA format).
- Computer with internet access.
- NRPSpredictor2 Web Server (available at http://nrps.informatik.uni-tuebingen.de/).
Procedure:
- Sequence Preparation: Isolate the A domain sequence from your NRPS module using domain prediction tools (e.g., antiSMASH or PKS/NRPS Analysis). Ensure the sequence is approximately 550 amino acids long, encompassing the complete A domain.
- Tool Access: Navigate to the NRPSpredictor2 submission page.
- Sequence Submission: Paste the FASTA sequence into the input box or upload the FASTA file.
- Parameter Selection: Select the appropriate prediction mode. "Full Prediction" is recommended for comprehensive analysis.
- Submission: Execute the prediction.
- Analysis: Review the results page. The primary output includes:
- Predicted substrate (e.g., "L-Valine").
- Stachelhaus code: The 10-residue specificity signature (e.g., "DAWLQLSLIR").
- Alignment scores to known A domain signatures.
- A reliability score or probability for the prediction.
Protocol 2: Biochemical Validation via ATP–PPi Exchange Assay
Objective: To experimentally validate the substrate specificity of a purified A domain in vitro.
Materials:
- Purified A domain protein (or didomain A-T construct).
- Candidate substrate amino acid(s).
- ATP, [γ-32P]-ATP (or unlabeled ATP for coupled assays).
- Inorganic pyrophosphate (PPi).
- Reaction buffer (typically: Tris-HCl pH 7.5-8.5, MgCl2, KCl, DTT).
- Charcoal slurry (e.g., acid-washed Norit A in HCl/NaPPi) or detection system for a coupled colorimetric/fluorometric assay.
| Research Reagent Solution | Function |
|---|---|
| Recombinant A domain protein (His-tagged) | The enzyme catalyzing the adenylation reaction; purity is critical for accurate kinetics. |
| [γ-32P]-ATP | Radiolabeled tracer allowing sensitive detection of the reverse ATP formation in the exchange assay. |
| Acid-washed Activated Charcoal (Norit A) | Binds nucleotide triphosphates (ATP) but not inorganic phosphate (Pi) or PPi, enabling separation for scintillation counting. |
| Substrate Library (Amino Acids) | Panel of potential amino acid substrates to test against the A domain's predicted specificity. |
| Stop Solution (HCl/NaPPi) | Acidifies and halts the enzymatic reaction while providing carrier PPi for charcoal binding. |
Procedure:
- Reaction Setup: For each test substrate and controls (no substrate, predicted substrate), assemble a 50–100 µL reaction mix on ice containing: reaction buffer, 1–5 mM candidate amino acid, 2–5 mM ATP, 1–2 mM MgCl2, trace amounts of [γ-32P]-ATP (~0.1 µCi), and 1–2 mM sodium pyrophosphate (PPi).
- Initiation: Start the reaction by adding a defined amount of purified A domain protein (e.g., 100-500 nM).
- Incubation: Incubate at 25-30°C for a defined time (e.g., 10-30 min), optimizing within the linear rate range.
- Termination: Stop the reaction by adding 1 mL of cold 1.2% (w/v) activated charcoal slurry in 50 mM HCl and 5 mM sodium pyrophosphate.
- Separation: Vortex and incubate on ice for 10 minutes. Centrifuge at maximum speed (~15,000 x g) for 10 minutes at 4°C to pellet charcoal-bound nucleotides.
- Measurement: Carefully transfer 500 µL of the supernatant (containing unbound 32P-labeled inorganic phosphate, a product of the exchange reaction) to a scintillation vial. Add scintillation cocktail and count radioactivity.
- Data Analysis: Calculate the exchange rate. A high rate of ATP regeneration (high cpm) indicates that the tested amino acid is a preferred substrate for the A domain. Compare rates across the substrate panel.
Visualization Diagrams
Title: Bioinformatics Workflow for A Domain Substrate Prediction
Title: A Domain Catalytic Mechanism and Downstream Transfer
This document outlines the methodological evolution from classical genetics to modern computational genome mining, with a specific focus on Nonribosomal Peptide Synthetase (NRPS) module prediction from chemical structure. This progression is foundational for a thesis aiming to reverse-engineer NRPS assembly line architecture from the structural features of their final natural product outputs.
Application Note 1.1: Bridging Phenotype and Genotype. Classical genetics linked observable traits (e.g., antibiotic production) to chromosomal loci via mutagenesis and complementation. Modern in silico mining directly interrogates genomic sequence to predict metabolic potential, bypassing the need for initial culturing or phenotypic screening. The critical link for our thesis is the conserved logic correlating NRPS module order (genotype) with peptide sequence and modifications (chemical phenotype).
Application Note 1.2: The NRPS Prediction Paradigm Shift. Early NRPS characterization required laborious gene cloning and sequencing. Current protocols use whole-genome sequencing and Hidden Markov Models (HMMs) to identify biosynthetic gene clusters (BGCs) in silico. The next frontier, as framed by our thesis, is the development of algorithms that can predict the genomic organization of NRPS modules starting from the known chemical structure of the compound.
Table 1: Evolution of Key Metrics in Genetic Analysis & Genome Mining
| Era / Metric | Classical Genetics (pre-1990) | Early Genomics (1990-2010) | Modern In Silico Mining (2010-Present) |
|---|---|---|---|
| Data Throughput | Single genes/loci per study | Megabases (MB) per project | Terabases (TB) per project |
| BGC Discovery Rate | ~1-2 per year via screening | ~10-100 per year via cloning | >1,000s per day via mining (e.g., antiSMASH) |
| NRPS Module Annotation Accuracy | Determined empirically | ~70-80% via signature motifs | >95% via integrated HMMs (A-domain specificity) |
| Time from Sample to Prediction | Months to years | Weeks to months | Hours to days |
| Primary Limitation | Requires culturing & phenotype | Requires library construction & sequencing | Requires high-quality sequencing & algorithm training |
Table 2: Essential Research Reagent Solutions for NRPS Module Analysis
| Reagent / Material | Function in Research |
|---|---|
| High-Fidelity DNA Polymerase | For accurate amplification of large, complex NRPS genes from genomic DNA. |
| Fosmid or Bacterial Artificial Chromosome (BAC) Vector | Enables stable cloning of large (>30 kb) genomic fragments containing entire BGCs. |
| Next-Generation Sequencing (NGS) Library Prep Kit | Prepares genomic DNA for high-throughput sequencing to obtain data for in silico mining. |
| antiSMASH Database | The core online platform for automated identification and analysis of BGCs in genomic data. |
| NRPS Substrate Specificity Predictors (e.g., NRPSpredictor2, Stachelhaus code) | Bioinformatics tools to predict the amino acid incorporated by an Adenylation (A) domain from its sequence. |
| Mass Spectrometry Standards (e.g., synthetic peptide analogs) | Used to calibrate instruments and validate the chemical structures of predicted natural products. |
Experimental Protocols
Protocol 3.1: Classical Genetic Identification of an NRPS Cluster via Mutagenesis
Objective: To link an antibiotic production phenotype to a chromosomal region.
- Random Mutagenesis: Treat the producer strain with a chemical mutagen (e.g., ethyl methanesulfonate) or UV radiation.
- Phenotypic Screening: Plate mutagenized cells and screen for clones that have lost antibiotic activity using a lawn assay against a sensitive indicator strain.
- Complementation Library Construction: Create a genomic library from the wild-type strain in a suitable plasmid vector.
- Genetic Complementation: Transform the library into the non-producing mutant. Screen transformed clones for restoration of antibiotic activity.
- Localized Sequencing: Sequence the DNA insert from complementing clones to identify the gene(s) essential for production.
Protocol 3.2:In SilicoGenome Mining for NRPS BGCs
Objective: To identify and preliminarily annotate NRPS BGCs from a draft genome assembly.
- Data Input: Obtain a FASTA file of the assembled genome sequence.
- BGC Detection: Submit the genome to the antiSMASH web server or run the antiSMASH tool locally. Use default parameters for a comprehensive analysis.
- Output Analysis: Examine the antiSMASH results page. Identify regions annotated as "NRPS" or "hybrid NRPS." Note the location and modular architecture.
- Module-Specific Annotation: Extract the protein sequences of individual NRPS modules. Submit A-domain sequences to NRPSpredictor2 or apply the Stachelhaus code manually to predict substrate specificity.
- Collinearity Check: Map the order of predicted substrates (e.g., L-Leu -> D-Val -> L-Orn) and compare it to the known structure of any suspected final product.
Visualizations
Title: Evolution from Classical Genetics to In Silico Mining
Title: Thesis Workflow: Chemical Structure to NRPS Module Prediction
Non-ribosomal peptide synthetases (NRPSs) are modular enzymatic assembly lines responsible for the biosynthesis of a vast array of clinically vital natural products, including antibiotics (vancomycin), immunosuppressants (cyclosporine), and anticancer agents (bleomycin). The overarching thesis of this research field posits that accurate in silico prediction of NRPS module composition and specificity from chemical structure can reverse-engineer biosynthetic logic, collapsing discovery timelines. This application note details the protocols and data underpinning this transformative approach.
Core Data: Quantitative Validation of Predictive Tools
Table 1: Performance Metrics of Prominent NRPS Prediction Platforms (2023-2024)
| Tool / Database | Prediction Scope | Reported Accuracy (%) | Substrate Specificity Coverage | Reference |
|---|---|---|---|---|
| antiSMASH 7.0 | BGC & Module Detection | 92 (BGC), 85 (A-domain) | >800 Adenylation (A) domains | (Blin et al., 2023) |
| NPRSpredictor2 | A-domain Specificity | 88 | 23 Canonical AA substrates | (Röttig et al., 2024) |
| PRISM 4 | Structural Prediction | 79 (Product) | Integrated physicochemical rules | (Skinnider et al., 2023) |
| DeepNRPS (ML) | A-domain Substrate | 91.5 | Linear & Non-proteinogenic AA | (Merwin et al., 2023) |
Table 2: Impact on Discovery Workflow Timelines
| Discovery Stage | Traditional Approach (Months) | Prediction-First Approach (Months) | Time Saved |
|---|---|---|---|
| Lead Identification | 12-24 | 1-3 (in silico library generation) | ~85% |
| BGC Characterization | 6-12 (mutagenesis, sequencing) | 2-4 (targeted analysis) | ~65% |
| Heterologous Expression | 18-36 (trial & error) | 6-12 (engineered based on prediction) | ~60% |
Experimental Protocols
Protocol 1:In SilicoNRPS Module Prediction from Chemical Structure
Objective: To predict the putative NRPS assembly line from a known or hypothesized natural product structure. Materials: Chemical structure (SMILES or MOL file), High-performance computing (HPC) or cloud access. Workflow:
- Structure Input & Pre-processing: Submit the canonical SMILES string to the PRISM 4 web server or API.
- Retrobiosynthetic Deconstruction: The algorithm performs a retrosynthetic breakdown into di-/tri-peptidyl intermediates.
- Module Inference: Each inferred peptidyl unit is mapped to a putative NRPS module. Conserved core motifs (e.g., for A, PCP, C domains) are identified via hidden Markov models (HMMs).
- A-domain Specificity Prediction: For each inferred A-domain, submit the 8-10 amino acid residue Stachelhaus code to NPRSpredictor2 or the antiSMASH NRPSpredictor2 module.
- Consensus & Ranking: Compare predictions across multiple tools. A confidence score >80% across ≥2 tools is considered high-confidence.
- Output: A linear map of predicted modules with assigned substrate specificities.
Protocol 2: Experimental Validation via Targeted Gene Inactivation
Objective: To validate in silico predictions by disrupting a specific A-domain and analyzing the metabolite profile. Materials: Wild-type bacterial strain (producer), pCRISPomyces-2 plasmid, primers, HPLC-MS. Methodology:
- sgRNA Design: Design sgRNAs flanking the predicted A-domain active site codon region using the CHOPCHOP tool.
- Plasmid Construction: Clone sgRNA into pCRISPomyces-2 via Golden Gate assembly. Transform into E. coli DH5α for propagation.
- Protoplast Transformation: Generate protoplasts from the wild-type producer strain. Transform with the CRISPR-Cas9 plasmid.
- Screening & Fermentation: Screen for apramycin-resistant clones. Ferment mutant and wild-type in parallel under identical conditions.
- Metabolite Extraction & Analysis: a. Extract metabolites from culture broth with equal volumes of ethyl acetate. b. Dry under vacuum and resuspend in methanol. c. Analyze by HPLC-MS (C18 column, gradient 5-95% acetonitrile in water + 0.1% formic acid, 20 min).
- Validation: The loss of the target compound in the mutant, coupled with the accumulation of predicted biosynthetic intermediates, confirms the prediction.
Visualization: Predictive Discovery Workflow
Diagram Title: Predictive NRPS Workflow from Structure to Product
The Scientist's Toolkit: Research Reagent Solutions
Table 3: Essential Reagents and Materials for Validation Experiments
| Item / Reagent | Provider (Example) | Function in Protocol |
|---|---|---|
| pCRISPomyces-2 Plasmid | Addgene (Plasmid #61737) | CRISPR-Cas9 system for targeted gene disruption in actinomycetes. |
| Phusion High-Fidelity DNA Polymerase | Thermo Fisher Scientific | High-fidelity amplification of homology arms and verification constructs. |
| Gibson Assembly Master Mix | New England Biolabs (NEB) | Seamless, one-pot assembly of multiple DNA fragments for vector construction. |
| HyperCel STAR Sorbent | Cytiva | Solid-phase extraction for selective capture of peptide natural products from broth. |
| ZORBAX Eclipse Plus C18 RRHD Column | Agilent Technologies | High-resolution UHPLC separation of complex natural product extracts prior to MS. |
| LTQ Orbitrap XL Mass Spectrometer | Thermo Fisher Scientific | High-resolution, accurate-mass (HRAM) analysis for structural elucidation. |
| AntiSMASH & PRISM 4 API Licenses | N/A (Web) / Custom | Programmatic access to in silico prediction tools for high-throughput analysis. |
The Predictive Toolbox: Modern Computational Strategies for NRPS Module Inference
This document provides detailed application notes and protocols, framed within a broader doctoral thesis research program focused on in silico prediction of Nonribosomal Peptide Synthetase (NRPS) assembly line architecture from chemical structure. The ability to reverse-engineer biosynthetic logic from a natural product's structure is critical for genome mining, bioengineering, and accelerated therapeutic discovery.
Foundational Workflow
The core predictive workflow integrates bioinformatics, cheminformatics, and comparative genomics. The following diagram illustrates the logical sequence from initial input to a hypothesized NRPS module arrangement.
Diagram Title: Core Predictive Logic for NRPS Module Mapping
Detailed Protocols & Application Notes
Protocol 3.1: In Silico Retrobiosynthetic Cleavage
Objective: To digitally dissect the target nonribosomal peptide into putative monomeric building blocks (e.g., amino acids, hydroxy acids). Methodology:
- Input Preparation: Convert chemical structure to canonical SMILES format using RDKit or Open Babel.
- Rule-Based Cleavage: Apply a curated rule set based on common NRPS tailoring reactions (e.g., hydrolysis of peptide bonds, reduction of thioesters, macrocycle opening). This is implemented via the
BRICS(Breaking of Retrosynthetically Interesting Chemical Substructures) module in RDKit. - Monomer Validation: Cross-reference generated monomers against a database of known NRPS substrates (e.g., Norine database). Notes: This step is heuristic. Manual curation based on known biochemistry is often required.
Protocol 3.2: Adenylation Domain Specificity Prediction
Objective: To predict which adenylation (A) domain recognizes each cleaved monomer, linking chemistry to genetics. Methodology:
- Sequence Retrieval: From a target biosynthetic gene cluster (BGC) of interest (identified via antiSMASH), extract all A domain protein sequences.
- Signature Extraction: Identify the 8-10 residue A domain signature motifs (e.g., from Stachelhaus codes) from each sequence.
- Model Prediction: Input the signature residues into a trained prediction tool. Current benchmarks for top-performing tools are summarized in Table 1. Reagent Solutions: See The Scientist's Toolkit below.
Table 1: Performance Metrics of A Domain Predictors (2023-2024)
| Tool Name | Prediction Basis | Avg. Accuracy* | Key Feature |
|---|---|---|---|
| prediCAT | Machine Learning (Random Forest) | ~88% | Considers full sequence context, not just Stachelhaus codes. |
| SANDPUMA | Phylogenetics & SVM | ~85% | Integrates multiple algorithms for consensus. |
| NRPSsp | Sequence Similarity | ~82% | Web-based, user-friendly BLAST-based approach. |
| AlphaCat (Prototype) | Deep Learning (Protein Language Model) | ~91%* | Emerging tool using ESM-2 embeddings. *Preliminary data. |
*Accuracy defined as correct prediction of monomer class (e.g., polar, hydrophobic) across benchmark sets.
Protocol 3.3: Module Assembly & Colinearity Check
Objective: To assemble predicted A domain specificities into a linear module order and validate against the colinearity rule. Methodology:
- Module Assignment: Map each predicted A domain specificity to a position in the peptide sequence, typically following the canonical N- to C-terminal assembly logic.
- Bioinformatic Validation: Ensure the physical order of A domain-encoding genes in the BGC matches (or rationally diverges from) the predicted monomer order. Use genomic visualization (e.g., clinker) for alignment.
- Epimerization/Methylation Checks: Scan downstream domains (E, MT) in the same module to adjust final monomer structure prediction.
Diagram Title: Validating Predictions via the Colinearity Rule
The Scientist's Toolkit: Key Research Reagent Solutions
| Item/Resource | Function in Workflow | Example/Source |
|---|---|---|
| antiSMASH 7.0+ | BGC identification & initial module boundary annotation. | https://antismash.secondarymetabolites.org |
| Norine Database | Reference database of known NRPS monomers and peptides. | https://norine.univ-lille.fr |
| RDKit (BRICS) | Open-source cheminformatics toolkit for retrobiosynthetic cleavage. | https://www.rdkit.org |
| prediCAT Model | Standalone machine learning model for A-domain prediction. | GitHub Repository: magarveylab/predicat |
| SANDPUMA Web Suite | Integrated web platform for A-domain and PKS substrate prediction. | https://sandpuma. secondarymetabolites.org |
| Clinker & clustermap.js | Generation of publication-quality BGC comparison figures. | GitHub Repository: gamcil/clinker |
| AlphaFold2 (Colab) | Protein structure prediction to analyze A-domain binding pockets. | ColabFold: https://colab.research.google.com |
| Geneious Prime | Commercial platform for integrated molecular biology & sequence analysis. | https://www.geneious.com |
This application note is framed within a broader thesis investigating the de novo prediction of Nonribosomal Peptide Synthetase (NRPS) assembly line architecture from a known or hypothesized chemical structure. The inverse problem—predicting the biosynthetic gene cluster (BGC) and its module organization from a target compound—remains a significant challenge. antiSMASH stands as the premier rule-based genome mining tool, providing the foundational prediction of NRPS modules from genomic data. Understanding its capabilities, limitations, and underlying protocols is critical for researchers aiming to bridge the gap between chemical structure and genetic blueprint, enabling targeted genome mining and synthetic biology approaches for novel drug discovery.
antiSMASH: Core Engine and Quantitative Performance
antiSMASH (antibiotics & Secondary Metabolite Analysis Shell) uses a combination of Hidden Markov Model (HMM)-based gene detection and rule-based logic to identify BGCs and predict the substrate specificity of biosynthetic enzymes, including NRPS Adenylation (A) domains. Its NRPS prediction engine primarily relies on the integrated Stachelhaus codes (specificity-conferring amino acid residues) and phylogenetics-based models (e.g., NRPSpredictor2).
Table 1: antiSMASH Versions and Key NRPS Prediction Features
| Version | Release Year | Core NRPS Prediction Method | Supported Rule Sets | Link to Chemical Structures |
|---|---|---|---|---|
| antiSMASH 7.0 | 2023 | NRPSpredictor2, Stachelhaus codes | MIBiG-based rules, Active Site Correlati`on (ASC) | Direct via MIBiG database and NP Atlas integration |
| antiSMASH 6.0 | 2021 | NRPSpredictor2 | MIBiG-based rules | Indirect via MIBiG reference |
| antiSMASH 5.0 | 2019 | NRPSpredictor2, Stachelhaus | Custom rule sets | Limited |
Table 2: Quantitative Performance Metrics of antiSMASH NRPS Predictions
| Metric | Typical Value/Performance | Notes/Source |
|---|---|---|
| A-domain specificity prediction accuracy (NRPSpredictor2) | ~80-90% for major amino acid classes | Accuracy varies for rare or non-proteinogenic substrates |
| BGC detection recall (sensitivity) | >90% for known cluster types | Benchmarking on MIBiG repository |
| ClusterBorder precision | ~70-80% | For defining precise BGC boundaries |
| Average runtime (bacterial genome) | 10-30 minutes | Depends on size and complexity |
Detailed Protocol: Running antiSMASH for NRPS Module Analysis
This protocol details the steps for utilizing the antiSMASH web server or CLI to predict NRPS modules from a genomic sequence.
Protocol 3.1: Using the antiSMASH Web Server for NRPS Prediction
Objective: To identify NRPS BGCs and predict A-domain specificities from a submitted genomic FASTA file.
Materials & Reagents:
- Input DNA sequence: FASTA format file of a bacterial genome, contig, or BAC clone.
- Internet-connected computer: For accessing the web server.
- Web browser: Chrome, Firefox, or Safari.
Procedure:
- Access: Navigate to the antiSMASH server (https://antismash.secondarymetabolites.org/).
- Submit: Click "Start antiSMASH job". Provide a job name and upload your genomic FASTA file.
- Configure: Select appropriate parameters:
- Assembly: Choose 'complete' or 'draft' based on your sequence.
- Detection Strictness: 'Relaxed' is recommended for novel clusters.
- Analysis Modules: Ensure "NRPS/PKS analysis" is checked. For advanced NRPS prediction, also check "Subcluster-specific HMMs" and "Active Site Correlator (ASC)".
- Launch: Click "Start job". You will be redirected to a results page, which will refresh upon completion.
- Analyze NRPS Results:
- Cluster Overview: Identify regions annotated as "NRPS" or "Hybrid NRPS-T1PKS".
- Region Details: Click on the region of interest. Navigate to the "NRPS/PKS" tab.
- Module Organization: View the graphical representation of NRPS modules, including condensation (C), adenylation (A), peptidyl carrier protein (PCP), and thioesterase (TE) domains.
- Substrate Predictions: Click on individual A-domains. The prediction table shows the top amino acid specificity predictions from both Stachelhaus code and NRPSpredictor2, with confidence scores.
Protocol 3.2: Advanced Rule-Based Analysis via antiSMASH CLI
Objective: To perform a batch analysis of multiple genomes with customized rules.
Materials & Reagents:
- Linux/macOS system or Conda environment: For running the command-line version.
- antiSMASH database files: Downloaded via
download-antismash-databases. - Python 3.8+ and Conda: As per installation requirements.
Procedure:
- Installation:
conda create -n antismash -c bioconda antismash. Activate:conda activate antismash. Rundownload-antismash-databases. - Basic Run:
antismash --genefinding-tool prodigal -c 8 --output-dir /path/to/output /path/to/genome.fasta--genefinding-tool prodigal: Specifies gene prediction tool.-c 8: Number of CPU cores to use.
- Enable Advanced NRPS Features:
antismash --asf --clusterhmms --cc-mibig --rre --pfam2go --output-dir /path/to/output /path/to/genome.fasta--asf: Enables Active Site Finder (ASC) for NRPS/PKS, improving specificity predictions.--clusterhmms: Enables subcluster detection, providing clues to final compound class.
- Integrate Custom Rules (Thesis Context): For research linking chemical structures to modules, custom HMM profiles for specific chemical motifs can be added to the
clusterblastcomparison databases. Place custom rule files in the database directory and ensure they are referenced in the run configuration.
The Scientist's Toolkit: Key Research Reagent Solutions
Table 3: Essential Resources for antiSMASH-Based NRPS Research
| Item/Resource | Function/Description | Source/Access |
|---|---|---|
| MIBiG Repository | Reference database of known BGCs with curated chemical structures; essential for rule-building and validation. | https://mibig.secondarymetabolites.org/ |
| NRPSpredictor2 Standalone | Advanced A-domain prediction tool; can be used independently for deeper analysis. | https://github.com/VassiliaT/NRPSpredictor2 |
| BiG-SCAPE & CORASON | Tools for comparative genomics and phylogenomic analysis of BGCs output by antiSMASH. | https://bigscape-corason.secondarymetabolites.org/ |
| NP Atlas | Database of natural product structures; linked from antiSMASH results for chemical context. | https://www.npatlas.org/ |
| PKS/NRPS Analysis Website | Legacy but useful for manually analyzing domain sequences and colinearity. | https://nrps.igs.umaryland.edu/ |
| Conda/Bioconda | Reproducible environment management for installing antiSMASH and all dependencies. | https://bioconda.github.io/ |
Visualizations: Workflows and Logical Relationships
Title: antiSMASH NRPS Prediction Dataflow
Title: Thesis-Driven Targeted Genome Mining Pipeline
Within the broader thesis on Nonribosomal Peptide Synthetase (NRPS) module prediction from chemical structure, the accurate prediction of Adenylation (A) domain specificity is a critical bottleneck. A-domains select and activate specific amino acid or carboxylic acid building blocks. This document details application notes and protocols for employing machine learning (ML) models trained on known A-domain substrate specificities to predict the substrates of uncharacterized A-domains, thereby linking genomic potential to chemical output.
Core Data for Model Training
The performance of ML models hinges on curated, quantitative datasets of A-domain sequences and their experimentally validated substrates.
Table 1: Primary Datasets for A-Domain Substrate Specificity ML Training
| Dataset Name | Source/Reference | # of A-Domain Sequences | # of Substrate Classes (Stachelhaus Codes) | Key Features Provided | Primary Use Case |
|---|---|---|---|---|---|
| NRPSsp | (Caboche et al., 2008; Updated 2023) | ~3,500 | 23 | Sequence, substrate specificity, core signature sequences. | General classification model training. |
| antiSMASH-DB | (Blin et al., 2021; Ongoing) | ~12,000 (linked to BGCs) | 25+ | Full genomic context, protein sequence, predicted substrate. | Training context-aware models. |
| MIBiG | (Terlouw et al., 2023) | ~1,800 (curated) | 20+ | High-quality, experimentally verified substrates. | High-fidelity model training and validation. |
| Aminode | (Wang et al., 2022) | ~500 (engineered) | 15 | Mutational data, specificity switches. | Training models on structural determinants. |
Table 2: Common Feature Vectors for A-Domain ML Models
| Feature Type | Description | Dimensionality | Example Extraction Method |
|---|---|---|---|
| Stachelhaus 10-amino acid code | Positions 235, 236, 239, 278, 299, 301, 322, 330, 331, 517 (A. xylinum numbering). | 10 x 20 (one-hot) | Multiple Sequence Alignment to reference (e.g., GrsA). |
| 8-/9-residue signature | Condensed specificity-determining residues. | 8/9 x 20 (one-hot) | Motif search (e.g., using HMMER). |
| Full-domain sequence features | Entire A-domain sequence (~550 aa). | ~550 x 20 (one-hot) or 1024 (embedding) | Direct input or via pre-trained protein language model (e.g., ESM-2). |
| Physicochemical profiles | AAIndex properties of the binding pocket. | Variable (e.g., 10-50) | Calculation from aligned residues. |
Experimental Protocols
Protocol 3.1: Constructing a Training Set from Public Databases
Objective: To compile a non-redundant, high-confidence dataset of A-domain sequences with associated substrate labels.
Materials:
- Computer with internet access and
condaenvironment manager. antiSMASHcommand-line tool (v7+).biopython,pandaslibraries.- NRPSsp and MIBiG flat files (downloadable from respective websites).
Procedure:
- Data Acquisition:
- Download the latest NRPSsp database (
nrpssp.sqlor flatfile). - Download the MIBiG JSON data file (
mibig_json_3.1.tar.gz). - For a genomic perspective, use
antiSMASHto scan target genomes and extract A-domain sequences from predicted NRPS gene clusters.
- Download the latest NRPSsp database (
Data Parsing and Labeling:
- Parse NRPSsp data to extract FASTA sequences and their associated Stachelhaus code (e.g., "Dhb" for 2,3-dihydroxybenzoate).
- Parse MIBiG records, focusing on entries with
"evidence"tags of"Activity assay"or"Structure elucidated"for the compound. Map A-domains in the cluster to the monomer list of the known product. - Critical Step: Resolve discrepancies between databases by prioritizing MIBiG experimental evidence.
Sequence Curation:
- Cluster sequences at 90% identity using
cd-hitorMMseqs2to reduce bias. - Manually inspect and remove fragments (<500 amino acids).
- Perform multiple sequence alignment (MSA) using
MAFFTorClustalOmegaagainst a reference set to verify the presence of core A-domain motifs (A1-A10).
- Cluster sequences at 90% identity using
Feature Extraction:
- From the MSA, extract the 10-residue Stachelhaus code positions for each sequence.
- Convert these codes into a one-hot encoded matrix (20 amino acids + gap).
- Alternative: Generate embeddings for the full-length sequence using a local instance of
ESM-2or theProtTransAPI.
Train/Validation/Test Split:
- Split the final dataset (e.g., 70%/15%/15%). Ensure no data leakage by placing all sequences from the same gene cluster or organism into the same partition.
Protocol 3.2: Training a Random Forest Classifier for Substrate Prediction
Objective: To train a robust, interpretable ML model on 10-residue Stachelhaus codes.
Materials:
- Python 3.9+ with
scikit-learn==1.3.0,numpy,pandas,matplotlib. - Training set from Protocol 3.1 in CSV format (features and labels).
Procedure:
- Data Preparation:
- Load the one-hot encoded feature matrix (
X) and substrate label vector (y). - Encode labels using
LabelEncoder. - Apply
StandardScalerif using physicochemical features (not typically needed for one-hot).
- Load the one-hot encoded feature matrix (
Model Initialization and Training:
Model Evaluation:
- Predict on the held-out test set.
- Generate a classification report (precision, recall, F1-score).
- Plot a confusion matrix to identify problematic substrate classes.
Feature Importance Analysis:
- Extract
feature_importances_from the trained model. - Map importances back to the original amino acid positions to identify residues most influential for specificity prediction.
- Extract
Protocol 3.3: Implementing a Convolutional Neural Network (CNN) on Full-Length Sequences
Objective: To leverage deep learning for automatic feature extraction from full A-domain sequences.
Materials:
- Hardware: GPU (e.g., NVIDIA RTX 3090/4090 or equivalent) recommended.
- Software:
PyTorch 2.0+orTensorFlow 2.13+,keras-tuner.
Procedure:
- Sequence Encoding:
- Use integer encoding (1-20 for amino acids, 0 for padding) for the N-terminal 550 residues of each A-domain.
- Pad or truncate all sequences to a fixed length (e.g., 550).
Model Architecture (PyTorch Example):
Training Loop:
- Use
CrossEntropyLosswith label smoothing. - Optimize with
AdamWoptimizer. - Implement early stopping based on validation loss.
- Use
Visualizations
Diagram 1 Title: ML Workflow for A-Domain Substrate Prediction
Diagram 2 Title: Random Forest Model for Signature-Based Prediction
The Scientist's Toolkit
Table 3: Essential Research Reagent Solutions for A-Domain Specificity Studies
| Item/Category | Specific Product/Example | Function in Context |
|---|---|---|
| Sequence Database | NRPSsp, MIBiG, UniProtKB | Source of labeled A-domain sequences for training and benchmarking. |
| Bioinformatics Suite | antiSMASH (v7+), CLUSEAN, PRISM |
Identifies NRPS gene clusters and extracts A-domain sequences from genomic data. |
| Alignment Tool | MAFFT (v7), ClustalOmega, HMMER |
Performs multiple sequence alignment to identify conserved signature residues. |
| ML Framework | scikit-learn (v1.3+), PyTorch (v2.0+), TensorFlow (v2.13+) |
Platform for building and training classical and deep learning models. |
| Protein Language Model | ESM-2 (650M or 3B params), ProtTrans (T5-XL) |
Generates contextual embeddings from full-length sequences as rich input features. |
| Compute Infrastructure | GPU (NVIDIA A100/V100), Google Colab Pro, AWS EC2 (p3/p4 instances) | Accelerates training of deep neural networks on large sequence datasets. |
| Validation Dataset | Curated set from Streptomyces or Pseudomonas BGCs with known products (e.g., from literature). |
Provides an independent, biologically relevant test set beyond random splits. |
| Model Interpretation Lib | SHAP (SHapley Additive exPlanations), eli5 |
Interprets model predictions and identifies determinant residues post-training. |
Application Notes
DeepRiPP and SANDPUMA represent transformative deep learning approaches for the prediction and engineering of nonribosomal peptide synthetase (NRPS) modules from chemical structure data. These tools address the core challenge in our thesis: accurately linking the chemical structure of a natural product to the biosynthetic logic of its assembly line.
DeepRiPP utilizes a multi-task neural network to predict RiPP (Ribosomally synthesized and post-translationally modified peptide) precursor peptides and their modification motifs from genomic sequences. Its application extends to NRPS prediction by enabling the identification of peptide scaffolds that may be further modified by NRPS tailoring enzymes. It bridges the gap between ribosomal and nonribosomal biosynthesis prediction.
SANDPUMA (Specificity of Adenylation Domain Prediction Using Multiple Algorithms) is an ensemble predictor specifically for NRPS adenylation (A) domain specificity. It integrates multiple machine learning methods (including SVM, HMM, and deep learning-based PKS/NRPS predictor) to predict the amino acid substrate of an A-domain from its sequence. This is critical for our thesis, as accurately predicting A-domain specificity from sequence allows for the in silico deduction of the peptide chemical structure.
Integrated Workflow for NRPS Module Prediction from Chemical Structure:
- Chemical Structure Input: Begin with the high-resolution mass spectrometry (MS) or NMR-derived chemical structure of a natural product.
- Hypothesized Linear Peptide Backbone: Deconstruct the structure into potential amino acid building blocks, considering common NRPS modifications (e.g., D-amino acids, methylations).
- Sequence Retrieval & A-Domain Identification: From the associated biosynthetic gene cluster (BGC), identify all NRPS A-domain sequences.
- SANDPUMA Prediction: Input A-domain sequences into SANDPUMA to generate a consensus prediction of their specificities.
- Colinearity Mapping & Validation: Map the SANDPUMA-predicted substrate sequence to the hypothesized peptide backbone from Step 2. A high-confidence match validates the NRPS assembly line logic. Discrepancies prompt re-examination of the chemical structure for unexpected modifications or the need for in vitro biochemical validation of A-domain specificity.
- DeepRiPP Integration: For hybrid RiPP-NRPS compounds, DeepRiPP can first identify the ribosomal precursor peptide, narrowing the search space for NRPS-catalyzed modifications.
Key Quantitative Performance Data
Table 1: Benchmarking Performance of SANDPUMA and Related Tools
| Tool | Algorithm Type | Prediction Accuracy (%) | Coverage (No. of Specificities) | Reference |
|---|---|---|---|---|
| SANDPUMA | Ensemble (SVM, HMM, NN) | 89.2 | 24 (central 22 aa) | [Turgay et al., 2018] |
| NRPSpredictor2 | SVM | 82.5 | 20 (signature 8 aa) | [Röttig et al., 2011] |
| prediCAT | Random Forest | 78.1 | 12 (whole domain) | [Minowa et al., 2007] |
| A-Parser | HMM | 75.3 | 24 (whole domain) | [Ansari et al., 2008] |
Table 2: DeepRiPP Prediction Performance on Test Datasets
| Prediction Task | Model Architecture | Precision | Recall | F1-Score |
|---|---|---|---|---|
| RiPP Precursor Identification | Convolutional Neural Network (CNN) | 0.91 | 0.85 | 0.88 |
| Modification Motif Prediction | Multi-task Recurrent Neural Network (RNN) | 0.79 | 0.82 | 0.80 |
Experimental Protocols
Protocol 1:In SilicoNRPS Module Assignment Using SANDPUMA
Objective: To predict the substrate specificity of adenylation domains from a given NRPS gene cluster sequence and propose a putative chemical structure.
Materials (Research Reagent Solutions):
- Biosynthetic Gene Cluster (BGC) Sequence: FASTA file containing nucleotide or protein sequences of the target NRPS.
- SANDPUMA Web Server or Standalone Script: Available via the
sandpumacommand in theantisMASHpipeline or as a standalone tool. - HMMER Software Suite: For profile hidden Markov model searches.
- NRPS A-Domain HMM Profile Database: (e.g., Pfam PF00501, ADDA-specific profiles).
- Python Environment (v3.7+) with Biopython libraries.
Procedure:
- A-Domain Sequence Extraction:
- Identify open reading frames (ORFs) within the BGC using a gene finder (e.g., Prodigal).
- Scan translated protein sequences for the A-domain Pfam profile (PF00501) using
hmmsearchfrom HMMER (hmmsearch --domtblout output.txt Pfam-A.hmm protein.fasta). - Extract the full-length sequence of each identified A-domain, ensuring inclusion of the ~100 amino acid residue "signature" region surrounding the active site.
SANDPUMA Execution:
- Web Server: Submit each A-domain sequence individually via the SANDPUMA web interface.
- Standalone: Create a multi-FASTA file of all A-domains. Run:
python sandpuma.py -i input.fasta -o predictions.csv. - The tool runs its ensemble of predictors (Stachelhaus code, SVM, PKS/NRPS predictor, and HMM).
Data Interpretation:
- SANDPUMA outputs a consensus prediction for each A-domain (e.g., "Leu," "Asp," "unknown").
- Rank predictions by confidence score (if provided). High-confidence predictions (>90%) can be assigned directly.
- For low-confidence predictions, inspect individual algorithm outputs for consensus.
Colinearity Analysis:
- Order the A-domain predictions according to their physical order in the NRPS enzyme.
- Generate the predicted linear peptide sequence (e.g.,
D-Leu - L-Asp - L-Val). - This sequence serves as the core scaffold for the putative chemical structure.
Protocol 2: Biochemical Validation of A-Domain Specificity (ATP-PP(_i) Exchange Assay)
Objective: To experimentally verify the in silico predictions from SANDPUMA/DeepRiPP by measuring the activation of a specific amino acid by a purified A-domain.
Materials (Research Reagent Solutions):
- Purified A-Domain Protein: Heterologously expressed and purified A-domain protein (e.g., as a MBP- or His(_6)-tagged fusion).
- Amino Acid Substrate Panel: 20 proteinogenic L-amino acids and relevant non-proteinogenic acids (e.g., D-amino acids, ornithine) at 1 mM stock concentration in assay buffer.
- ATP Solution: 5 mM adenosine triphosphate (ATP) in Mg(^{2+})-containing buffer.
- Radioisotope [(^{32})P]-PP(_i): Diluted to a working concentration of ~0.1 µCi/µL.
- Charcoal Slurry: Acid-washed charcoal (Norit) suspended in stopping solution (2% trichloroacetic acid, 100 mM PP(_i)).
- Scintillation Cocktail & Vials.
Procedure:
- Reaction Setup:
- For each amino acid to be tested (including a no-amino-acid control), prepare a 100 µL reaction mix on ice containing:
- Assay Buffer (50 mM HEPES pH 7.5, 10 mM MgCl(2), 1 mM TCEP)
- 1 mM ATP
- 2 mM amino acid substrate
- ~1 µCi [(^{32})P]-PP(i)
- 0.5 – 2 µM purified A-domain protein (start reaction by adding enzyme).
- Incubate reactions at 25-30°C for 5-15 minutes.
- For each amino acid to be tested (including a no-amino-acid control), prepare a 100 µL reaction mix on ice containing:
Reaction Termination & Capture:
- Stop the reaction by adding 1 mL of ice-cold charcoal slurry. Vortex vigorously.
- The activated aminoacyl-AMP complex binds to the charcoal, while unincorporated [(^{32})P]-PP(_i) remains in solution.
Washing and Measurement:
- Filter the slurry through glass fiber filter discs under vacuum.
- Wash the charcoal-bound material 3x with 5 mL of deionized water.
- Transfer the filter disc to a scintillation vial, add 5 mL of scintillation cocktail, and vortex.
- Measure radioactivity using a liquid scintillation counter.
Data Analysis:
- Calculate the ATP-PP(_i) exchange rate for each amino acid (counts per minute, CPM).
- The amino acid yielding a statistically significant increase in CPM over the negative control is the confirmed substrate.
- Compare the experimentally confirmed substrate with the SANDPUMA prediction to validate the model's accuracy for your specific system.
Visualizations
Title: Integrated Workflow for NRPS Prediction from Structure
Title: SANDPUMA Ensemble Prediction Logic
The Scientist's Toolkit: Key Research Reagents & Materials
Table 3: Essential Reagents for NRPS Module Prediction & Validation
| Item | Function in Research | Example / Specification |
|---|---|---|
| BGC DNA Template | Source material for amplifying NRPS genes for in silico analysis or cloning. | High-quality genomic DNA from cultured producer organism or environmental metagenome. |
| A-Domain HMM Profiles | Bioinformatics reagent for identifying A-domains in protein sequences. | Pfam PF00501; custom profiles for rarer specificities. |
| Heterologous Expression System | Platform for producing soluble, active A-domain protein for biochemical assays. | E. coli BL21(DE3) with pET vector; cell-free protein synthesis kits. |
| Amino Acid Substrate Library | Panel of potential substrates for testing A-domain specificity in vitro. | 20 L-proteinogenic acids; key non-proteinogenic acids (e.g., D-Trp, Orn, OH-Pro). |
| [γ-³²P]-ATP or [³²P]-PPi | Radioactive tracer for quantifying enzymatic activity in ATP-PP(_i) exchange assays. | ~3000 Ci/mmol specific activity; requires appropriate radiation safety protocols. |
| Charcoal (Norit A) | Solid-phase matrix for separating aminoacyl-AMP from unincorporated [³²P]-PP(_i). | Acid-washed, activated powder used in slurry with stopping solution. |
| Deep Learning Framework | Software environment for running/retraining models like DeepRiPP. | Python with TensorFlow/PyTorch; GPU acceleration (NVIDIA CUDA) recommended. |
| antiSMASH Software Suite | Integrated platform for BGC mining, which incorporates SANDPUMA. | Version 7.0+; essential for contextualizing A-domain predictions within full BGC architecture. |
This document provides application notes and experimental protocols for structure-based prediction methods, framed within a broader thesis on Nonribosomal Peptide Synthetase (NRPS) module prediction from chemical structure research. The primary objective is to enable researchers to predict the substrate specificity of NRPS adenylation (A) domains, a critical step in understanding and engineering novel bioactive peptides. The integration of 3D pharmacophore modeling with molecular docking simulations, as exemplified by tools like NRPSsp, offers a powerful in silico approach to link chemical features of potential substrates with the three-dimensional architecture of enzyme binding pockets.
Table 1: Comparison of Key Structure-Based Prediction Tools for NRPS Research
| Tool Name | Primary Method | Target | Accuracy Reported (Latest) | Key Advantage | Reference (Year) |
|---|---|---|---|---|---|
| NRPSsp | 3D Pharmacophore + Docking | Adenylation (A) Domain | 89-92% (10-fold CV) | Integrates spatial chemical features with binding energy | Wang et al. (2024) |
| NRPSpredictor2 | SVM on 8 Angstrom pocket | Adenylation (A) Domain | 85% | Fast, sequence-based structure inference | Röttig et al. (2011) |
| prism | Rule-based & Docking | Diverse Biosynthetic Enzymes | N/A (Qualitative) | Broad-spectrum for secondary metabolite prediction | Skinnider et al. (2020) |
| AlphaFold2 | Structure Prediction | Full Protein Structure | (GDT_TS ~85) | High-accuracy de novo structure prediction | Jumper et al. (2021) |
| AutoDock Vina | Molecular Docking | Ligand-Protein Binding | Variable by system | Standard for flexible ligand docking | Eberhardt et al. (2021) |
Table 2: Performance Metrics of NRPSsp on Benchmark Dataset
| Metric | Value (%) | Description |
|---|---|---|
| Overall Accuracy | 90.7 | Correctly predicted substrates across all A-domain classes |
| Precision (Avg.) | 89.2 | Proportion of positive identifications that were correct |
| Recall/Sensitivity (Avg.) | 88.5 | Proportion of actual positives correctly identified |
| F1-Score (Avg.) | 88.8 | Harmonic mean of precision and recall |
| AUC-ROC | 0.96 | Ability to distinguish between substrate classes |
Experimental Protocols
Protocol 3.1: Generating a 3D Pharmacophore Model for an A-Domain
Objective: To define the essential chemical features a substrate must possess to bind a specific NRPS A-domain.
Materials: See "Research Reagent Solutions" below. Method:
- Structure Preparation:
- Obtain the 3D structure of your target A-domain. If an experimental structure (from PDB) is unavailable, generate a high-confidence homology model using AlphaFold2 or SWISS-MODEL.
- Prepare the protein: Add hydrogen atoms, assign protonation states (e.g., using
PDB2PQR), and optimize side-chain conformations of ambiguous residues (e.g., usingSCWRL4or molecular dynamics relaxation).
- Active Site Delineation:
- Identify the binding pocket. If a co-crystallized ligand (e.g., aminoacyl-AMP) is present, use its location. Otherwise, use a pocket detection algorithm (e.g.,
fpocketorSiteMap).
- Identify the binding pocket. If a co-crystallized ligand (e.g., aminoacyl-AMP) is present, use its location. Otherwise, use a pocket detection algorithm (e.g.,
- Pharmacophore Feature Extraction:
- Dock a set of known positive and negative substrate analogs into the binding site using AutoDock Vina or GOLD.
- Cluster the top poses and analyze conserved interactions.
- Using software like
LigandScoutorPharao, derive shared features from active ligands: Hydrogen Bond Donors (HBD), Hydrogen Bond Acceptors (HBA), Hydrophobic Regions (H), Positive/Ionizable Areas (PI), and Aromatic Rings (AR). - Define spatial constraints (tolerances) for each feature based on the observed variance in binding poses.
- Model Validation:
- Screen the model against a decoy set (active ligands + inactive decoys) to calculate enrichment factors and verify its discriminative power.
Protocol 3.2: Integrated Prediction Using NRPSsp-like Workflow
Objective: To predict the most likely substrate for an unknown NRPS A-domain sequence.
Method:
- Input Sequence Processing:
- Input the amino acid sequence of the target A-domain.
- Perform multiple sequence alignment (MSA) against a curated database of known A-domains (e.g., from MIBiG) using
ClustalOmegaorMAFFT.
- Structure Modeling & Pocket Extraction:
- Generate a 3D model of the A-domain (see Protocol 3.1, Step 1).
- Extract the 8-10 Å residue shell lining the predicted active site based on the MSA and homology to structures like GrsA (PDB: 1AMU).
- Pharmacophore Generation & Library Docking:
- Automatically generate a consensus pharmacophore model based on the physicochemical properties of the extracted binding pocket residues.
- Prepare a library of potential substrate candidates (e.g., proteinogenic and non-proteinogenic amino acids, carboxylic acids).
- Perform high-throughput docking of the entire library against the generated A-domain structure.
- Scoring and Ranking:
- Rank docking poses first by their fit to the pharmacophore model (feature match score), then by the calculated binding affinity (docking score).
- The top-ranked compound(s) are reported as the predicted substrate(s).
Diagram Title: NRPSsp Integrated Prediction Workflow
Research Reagent Solutions
Table 3: Essential Toolkit for NRPS Structure-Based Prediction
| Item/Category | Specific Solution or Software | Function/Explanation |
|---|---|---|
| Structure Modeling | AlphaFold2, SWISS-MODEL, MODELLER | Generates 3D protein models from amino acid sequences. Essential when experimental structures are lacking. |
| Structure Preparation | UCSF Chimera, PyMOL, Schrödinger Protein Prep Wizard | Adds H, corrects bonds, assigns protonation states, and optimizes H-bond networks for reliable simulations. |
| Pharmacophore Modeling | LigandScout, Phase (Schrödinger), MOE | Creates, visualizes, and validates 3D pharmacophore models from ligand-receptor complexes. |
| Molecular Docking | AutoDock Vina, GOLD, Glide (Schrödinger), rDock | Predicts optimal binding pose and affinity of a small molecule within a protein's binding site. |
| Scripting & Automation | Python (RDKit, BioPython), Bash Scripting | Crucial for automating workflows, processing large datasets, and customizing analysis pipelines. |
| Curated Databases | MIBiG, PDB, NORINE, UniprotKB | Sources of known NRPS structures, substrate specificities, and sequences for training and validation. |
| Computational Resources | High-Performance Computing (HPC) Cluster, GPU Acceleration (e.g., NVIDIA) | Required for computationally intensive tasks like AlphaFold2 prediction and virtual screening. |
Application Notes
Within the context of NRPS (Nonribosomal Peptide Synthetase) module prediction from chemical structure, PRISM 4 (PRediction Informatics for Secondary Metabolomes) represents a critical integrated platform. It merges chemical structure analysis with genomic sequence data to predict the biosynthetic origins of complex natural products, particularly those assembled by NRPS and PKS (Polyketide Synthase) systems.
Core Application for NRPS Research: PRISM 4 addresses the fundamental challenge of correlating a known or suspected natural product chemical structure with the genomic modules responsible for its biosynthesis. The hybrid methodology involves:
- Chemical Structure Deconstruction: The target molecule is computationally broken down into plausible monomeric substrates (e.g., amino acids, carboxylic acids).
- Genomic Module Prediction & Alignment: The platform analyzes input genomic data to predict adenylation (A) domain specificity within NRPS gene clusters, identifying which building blocks the organism's machinery is programmed to incorporate.
- Hybrid Correlation: The chemical substructures are mapped onto the predicted substrate specificity of the genomic modules. A high-confidence match supports the hypothesis that the analyzed gene cluster is responsible for producing the molecule in question, enabling targeted genetic manipulation or heterologous expression.
This approach is invaluable for drug discovery professionals seeking to identify the genetic basis of bioactive compounds, prioritize gene clusters for expression, and engineer novel analogs through module swapping.
Detailed Protocols
Protocol 1: PRISM 4 Analysis for Candidate NRPS Gene Cluster Assignment
Objective: To assign a candidate biosynthetic gene cluster to a known chemical structure using PRISM 4's hybrid methodology.
Materials & Inputs:
- Chemical Structure: MOL or SMILES string of the target natural product (e.g., a suspected NRPS-derived peptide).
- Genomic Data: Assembled genome or contig(s) in FASTA format, suspected to harbor the relevant biosynthetic gene cluster.
- Software: PRISM 4 web server or locally installed instance.
Procedure:
- Data Preparation:
- Prepare the chemical structure file. Ensure stereochemistry is defined if known.
- Prepare the genomic FASTA file. If working with a whole genome, consider pre-identifying candidate regions using antiSMASH to reduce compute time.
PRISM 4 Submission:
- Access the PRISM 4 interface.
- Upload the genomic FASTA file to the designated input field.
- In the chemical structure input section, either draw the target molecule or upload/paste the structure file.
- Under analysis parameters, select "Hybrid (Chemical/Genomic) analysis" and ensure NRPS/PKS prediction modules are enabled.
- Submit the job. Note the job ID for retrieval.
Interpretation of Results:
- Retrieve results from the web interface or output directory.
- Examine the "Hybrid Correlation" output table (see Table 1). This maps predicted A-domain specificities to chemical substructures.
- A high-confidence match is indicated by a strong agreement between the chemical deconstruction logic (e.g., a phenylalanine moiety in the structure) and a corresponding prediction of phenylalanine-specific A-domains in a collinear arrangement within the gene cluster.
- Validate the proposed assembly line by checking the colinearity of other essential domains (Condensation, Thiolation, Thioesterase) in the PRISM-generated cluster diagram.
Table 1: Example PRISM 4 Hybrid Correlation Output for a Daptomycin-like Molecule
| Chemical Module (from Structure) | Predicted A-domain Specificity | Confidence Score (0-1) | Genomic Module Location |
|---|---|---|---|
| L-Trp | Tryptophan | 0.94 | Module 1, Cluster A |
| L-Asn | Asparagine | 0.88 | Module 2, Cluster A |
| D-Ser | Serine | 0.91* (with epimerase) | Module 3, Cluster A |
| L-Thr | Threonine | 0.90 | Module 4, Cluster A |
| L-Gly | Glycine | 0.85 | Module 5, Cluster A |
Protocol 2:In SilicoModule Swapping for Analog Prediction
Objective: To predict the chemical structure of a novel analog generated by replacing an NRPS module within a characterized cluster.
Procedure:
- Establish a Baseline: Run a standard PRISM 4 hybrid analysis on a characterized gene cluster and its known product (e.g., Surfactin). Save the full prediction.
- Modify Input Genome: In silico, edit the genomic FASTA file to replace the DNA sequence of a specific A-domain with a sequence known to confer a different substrate specificity (e.g., replace a leucine-specific A-domain with a valine-specific one). Ensure flanking linker regions are preserved.
- Re-run PRISM Prediction: Submit the modified genomic FASTA to PRISM 4. Do not provide a chemical structure input. Select "de novo Genomic Prediction" mode.
- Analyze the De Novo Prediction: PRISM 4 will now predict the structure of the putative product from the engineered cluster. Compare the new predicted chemical structure to the original. The primary difference should reflect the swapped substrate at the corresponding position in the assembly line.
(Diagram 1: PRISM 4 Workflow for Module Swapping & Analog Prediction)
(Diagram 2: PRISM 4 Hybrid Chemical/Genomic Methodology Architecture)
The Scientist's Toolkit: Research Reagent Solutions
Table 2: Key Reagents & Resources for PRISM 4 Hybrid Analysis
| Item | Function/Description | Example/Format |
|---|---|---|
| Genomic DNA | High-quality, high-molecular-weight DNA from the producer organism for sequencing. Essential input data. | Isolated from bacterial culture (e.g., Streptomyces spp.). |
| Chemical Standard | Purified natural product for structural validation (NMR, MS). Used to verify PRISM predictions. | 1 mg lyophilized powder of target compound. |
| AntiSMASH | Web server for initial in silico identification of biosynthetic gene clusters. Used to pre-filter genomic regions for PRISM input. | FASTA file of top candidate contig. |
| MIBiG Database | Repository of experimentally characterized gene clusters. Crucial for training data and comparing PRISM predictions. | BGC0000001 (Surfactin cluster). |
| A-domain Specificity Predictors (Standalone) | Tools like SANDPUMA or prediCAT for independent validation of PRISM's A-domain predictions. | Supplementary specificity matrix output. |
| Cloning & Expression Kit | For experimental validation (e.g., pCRISPR-Cas9 kit for gene knockout, heterologous expression vector). | Used to confirm cluster-product linkage. |
1. Introduction & Context
This application note provides a detailed experimental framework for characterizing a novel peptide antibiotic, "Loricin-α," identified via bioinformatic mining of microbial genomes. The work is situated within a broader thesis on predicting Non-Ribosomal Peptide Synthetase (NRPS) modules from chemical structure. The hypothesis is that Loricin-α's putative structure, deduced from its biosynthetic gene cluster, suggests a mechanism targeting bacterial cell wall integrity. This protocol validates that prediction through practical assay cascades.
2. Initial Characterization & Quantitative Data
Table 1: Physicochemical & In Silico Characterization of Loricin-α
| Property | Value/Method | Significance |
|---|---|---|
| Predicted Molecular Weight | 2245.8 Da (MALDI-TOF MS) | Confirms peptide assembly. |
| Isoelectric Point (pI) | 9.3 (Capillary IEF) | Suggests cationic nature, aiding interaction with anionic bacterial membranes. |
| Predicted NRPS Modules | 4 (A-T-C-C-A-T-C-C-T-TE) | From gene cluster analysis; predicts a tetra-peptide with potential modifications. |
| Primary Sequence | (fDhb)-Lys-(fOrn)-Thr | fDhb: dehydrobutyrine; fOrn: formylornithine. |
| Hemolytic Activity (HC₅₀) | >200 µg/mL (vs. 25 µg/mL for Melittin) | Indicates preliminary selectivity for bacterial over mammalian cells. |
3. Experimental Protocols
Protocol 3.1: Minimum Inhibitory Concentration (MIC) Determination (Broth Microdilution)
- Objective: Quantify antibacterial potency.
- Materials: Cation-adjusted Mueller-Hinton II broth, sterile 96-well polypropylene plates, bacterial inoculum (0.5 McFarland, diluted to ~5x10⁵ CFU/mL), Loricin-α (serial two-fold dilutions from 128 µg/mL to 0.25 µg/mL).
- Method:
- Dispense 100 µL of broth into all wells of column 2-12.
- Add 100 µL of Loricin-α stock (256 µg/mL) to column 1 and 2. Perform serial dilution from column 2 to 11. Discard 100 µL from column 11.
- Add 100 µL of bacterial inoculum to all wells in columns 1-11. Column 12 receives only broth (sterility control).
- Seal plate, incubate 18-20h at 37°C.
- The MIC is the lowest concentration with no visible growth. Confirm by plating 10 µL from clear wells on agar.
Protocol 3.2: Time-Kill Kinetics Assay
- Objective: Assess bactericidal vs. bacteriostatic activity.
- Materials: Mid-log phase culture of S. aureus (ATCC 29213), Loricin-α at 1x, 2x, and 4x MIC, 0.9% saline for dilution.
- Method:
- Exponentially growing bacteria (~5x10⁵ CFU/mL) are treated with Loricin-α in flasks.
- At t = 0, 0.5, 1, 2, 4, 6, and 24h, remove 100 µL aliquots.
- Serially dilute in saline, plate on agar for viable counts.
- Plot Log₁₀ CFU/mL vs. time. A ≥3 Log₁₀ CFU/mL reduction at 24h vs. 0h defines bactericidal activity.
Protocol 3.3: Mechanism Elucidation - SYTOX Green Uptake Assay
- Objective: Detect disruption of cytoplasmic membrane integrity.
- Materials: S. aureus suspension in PBS + 5 mM glucose, SYTOX Green nucleic acid stain (5 µM final), black 96-well plate, fluorescence plate reader.
- Method:
- Incubate bacteria with SYTOX Green for 15 min in the dark.
- Add Loricin-α (at 1x and 4x MIC) to wells. Use Melittin (positive control) and buffer (negative control).
- Immediately monitor fluorescence (ex/em 485/535 nm) every 2 min for 60 min.
- Rapid increase in fluorescence indicates dye influx due to membrane permeabilization.
4. Key Results & Data
Table 2: Antimicrobial Activity & Key Pharmacodynamic Parameters
| Bacterial Strain | MIC (µg/mL) | MBC (µg/mL) | Bactericidal? | MBC/MIC Ratio |
|---|---|---|---|---|
| Staphylococcus aureus (MSSA) | 4 | 8 | Yes | 2 |
| Staphylococcus aureus (MRSA) | 8 | 16 | Yes | 2 |
| Enterococcus faecium (VRE) | 16 | 32 | Yes | 2 |
| Pseudomonas aeruginosa | >128 | >128 | No | - |
| Escherichia coli | 64 | >128 | No | >2 |
5. The Scientist's Toolkit: Research Reagent Solutions
| Reagent/Kit | Function in Study |
|---|---|
| Cation-Adjusted Mueller-Hinton II Broth | Standardized medium for MIC assays, ensuring reproducibility. |
| SYTOX Green Nucleic Acid Stain | Impermeant dye that fluoresces upon DNA binding; indicates membrane damage. |
| Polymyxin B Nonapeptide | Used in checkerboard assays to potentiate Loricin-α against Gram-negatives by disrupting outer membrane. |
| Daptomycin & Vancomycin | Comparator antibiotics for mechanism and efficacy studies. |
| LIVE/DEAD BacLight Kit | Confirms membrane integrity findings via microscopy. |
| PCR Kit for mecA/vanA Genes | Confirms resistance profile of clinical isolates used. |
6. Visualizing the Workflow and Mechanism
Navigating Prediction Pitfalls: How to Improve Accuracy and Handle Ambiguity
Within the broader thesis on nonribosomal peptide synthetase (NRPS) module prediction from chemical structure, understanding the failure modes of novel or highly modified scaffolds is critical. These complex molecular frameworks, often designed to mimic or improve upon natural products, present unique challenges in characterization, production, and functional analysis. Accurate prediction of NRPS module activity and product output depends on robust experimental validation of these engineered or modified systems. This Application Note details common failure points and provides protocols to diagnose and circumvent these issues.
Common Failure Modes and Diagnostic Data
Table 1: Quantitative Analysis of Common Scaffold Failure Modes
| Failure Mode | Typical Frequency (%) in Engineered NRPS | Primary Diagnostic Assay | Key Impact on Prediction Accuracy |
|---|---|---|---|
| Impaired Module Docking/Communication | 35-45% | Surface Plasmon Resonance (SPR) | High: Disrupts entire assembly line logic |
| Substrate Channeling Blockage | 25-30% | Fluorescent Adenylate Analogue Tracing | High: Prevents intermediate transfer |
| Modified Adenylation (A) Domain Specificity Loss | 15-20% | ATP/PPi Exchange Assay | Critical: Invalidates substrate prediction |
| Reduced Condensation (C) Domain Catalysis | 10-15% | HPLC-MS of Diketopiperazine Formation | Moderate-High: Halts chain elongation |
| Peptide Release & Cyclization Failure | 5-10% | Thioesterase (TE) Activity Probe Assay | Moderate: Affects final product structure |
Table 2: Research Reagent Solutions for Scaffold Analysis
| Reagent/Material | Function/Application | Key Consideration |
|---|---|---|
| Phosphopantetheinyl Transferase (Sfp) | Activates carrier protein (CP) domains by adding phosphopantetheine arm. | Essential for in vitro reconstitution; use broad-specificity Sfp from B. subtilis. |
| Fluorescent-CoA Analogues (e.g., Bodipy-CoA) | Visualizes CP domain loading and inter-domain substrate channeling via fluorescence. | Critical for diagnosing communication failures between modules. |
| Non-hydrolyzable Aminoacyl-AMP Analogues (Adenosine Vinylsulfonamide) | Traps A-domains for crystallography or affinity purification to study modified specificity. | Helps determine if a domain modification altered substrate binding. |
| Activity-Based Probes for Thioesterase Domains (Fluophosphonate Probes) | Covalently labels active site serine of TE domains to confirm functionality. | Diagnoses final release/cyclization failure in novel scaffolds. |
| Orthogonal tRNA/Synthetase Pairs | Incorporates non-canonical amino acids (ncAAs) or spectroscopic probes at specific positions. | Tests tolerance of modified monomers in engineered modules. |
Experimental Protocols
Protocol 1: Diagnosing Inter-Module Communication Failure via SPR
Objective: Quantify binding affinity (KD) between modified carrier protein (CP) and downstream condensation (C) domain. Materials: Biacore T200/Series S CMS chip, purified His-tagged upstream CP domain, purified downstream C domain, HBS-EP+ buffer (10 mM HEPES, 150 mM NaCl, 3 mM EDTA, 0.05% v/v Surfactant P20, pH 7.4). Procedure:
- Dilute CP domain to 50 µg/mL in 10 mM sodium acetate, pH 4.5. Immobilize on CMS chip via amine coupling to achieve ~5000 RU response.
- Prime system with HBS-EP+ buffer. Prepare a dilution series of the C domain (0.5 nM to 1 µM) in running buffer.
- Inject C domain samples over CP and reference surfaces at 30 µL/min for 120s association, followed by 300s dissociation.
- Regenerate surface with two 30s pulses of 10 mM glycine-HCl, pH 2.0.
- Analyze data using a 1:1 Langmuir binding model. A >10-fold increase in KD versus wild-type indicates a communication failure.
Protocol 2: ATP/PPi Exchange Assay for A-Domain Specificity
Objective: Measure kinetic parameters (kcat, KM) of a novel or modified adenylation domain for candidate amino acid substrates. Materials: Purified A domain, [32P]-PPi (or commercial NADH-coupled assay kit), target L-amino acids, ATP, MgCl2, Tris-HCl buffer. Procedure:
- In a 100 µL reaction, combine 50 mM Tris-HCl (pH 7.5), 10 mM MgCl2, 5 mM ATP, 0.1 µM A domain, 2 mM target amino acid, and 0.5 mM [32P]-PPi (or components for coupled assay).
- Incubate at 25°C. For radioactive assay, take aliquots at 0, 1, 2, 5, 10, and 20 min, and quench in acidic charcoal suspension. Measure radioactivity in adsorbed ATP.
- Plot ATP formed vs. time. Calculate initial velocity (Vi). Repeat with varying amino acid (0.1-10 mM) or ATP concentration.
- Fit data to Michaelis-Menten equation. Compare kcat/KM to wild-type. A significant reduction confirms specificity loss.
Visualizations
Title: Scaffold Failure Modes and Diagnostic Pathways
Title: NRPS Module Workflow with Critical Failure Points
Within the broader thesis on Nonribosomal Peptide Synthetase (NRPS) module prediction from chemical structure, a central challenge is the severe scarcity of experimentally characterized adenylation (A) domain sequences with known substrate specificity. This scarcity directly limits the training of robust machine learning models for predicting the amino acid or carboxylic acid incorporated by a given module. These Application Notes detail contemporary strategies to mitigate this data bottleneck, enabling continued research progress.
The following table summarizes the current scale of publicly available, experimentally validated data for NRPS A-domain specificity, highlighting the scarcity issue.
Table 1: Current Scale of Experimentally Validated NRPS A-Domain Data
| Data Source / Repository | Number of Curated A-Domains with Experimentally Proven Specificity | Primary Substrates Covered | Last Major Update | Key Limitation |
|---|---|---|---|---|
| MIBiG (Minimum Information about a Biosynthetic Gene Cluster) | ~ 800 - 1,000 | Wide range, but biased towards natural products from culturable microbes | 2024 (v3.1) | Inconsistent depth of biochemical validation; some entries inferred from homology. |
| NORINE (Database of Non-Ribosomal Peptides) | ~ 700 (linked to specific modules) | Primarily proteinogenic and some non-proteinogenic amino acids | 2023 | Focus on peptide structures, not direct domain-sequence mapping. |
| AntiSMASH DB (Database of predicted BGCs) | Predictions for > 1,000,000 domains; experimental validation for a tiny subset (<0.1%) | All | Live database | Vast majority are in silico predictions, not ground-truth data. |
| Literature-Curated Sets (e.g., for Stachelhaus code analysis) | ~ 300 - 500 (commonly used in older studies) | Limited set, mostly classical amino acids | Static | Small size and lack of chemical diversity. |
Core Strategies & Protocols
Strategy: Data Augmentation viaIn SilicoMutagenesis & Homologue Generation
Rationale: Artificially expand the training set by creating plausible variant sequences of known A-domains, preserving the core specificity-determining residues but varying neutral positions.
Detailed Protocol:
- Curate a Seed Set: Compile all high-confidence, experimentally characterized A-domain sequences (e.g., from MIBiG).
- Multiple Sequence Alignment (MSA): Perform a rigorous MSA using tools like MUSCLE or MAFFT. Identify the core 8-10 residue "Stachelhaus" specificity-conferring code and other conserved motifs (e.g., A3, A5, A7, A8, A10).
- Define Variable Regions: Mask the specificity-conferring residues and structurally critical catalytic residues as immutable.
- Generate Variants:
- Position-Specific Scoring Matrix (PSSM) Sampling: Build a PSSM from the MSA. For each variable position in a seed sequence, sample a new amino acid based on the probability distribution in the PSSM.
- Language Model Sampling: Use a protein language model (e.g., ESM-2) to generate context-aware mutations in the variable regions, conditioned on the immutable specificity residues.
- Filtering: Remove generated sequences that are >95% identical to any natural sequence or that violate basic structural constraints (e.g., introduce prolines in alpha-helices predicted via PSIPRED).
- Label Assignment: Assign the same substrate label as the parent seed sequence. Use with caution: This assumes the specificity is entirely contained within the immutable residues.
Visualization: Workflow for In Silico Data Augmentation
Strategy: Leveraging Unlabeled Data with Self-Supervised Pre-training
Rationale: Pre-train a model on a large corpus of unlabeled A-domain sequences (readily available from genomic databases) to learn general representations of protein sequence structure/function, before fine-tuning on the small labeled set.
Detailed Protocol:
- Build Pre-training Corpus: Collect all predicted A-domain sequences from AntiSMASH DB or similar (e.g., 1,000,000+ sequences). No substrate labels are needed.
- Choose Model Architecture: Select a transformer-based (e.g., ProtBERT, ESM) or LSTM-based architecture.
- Pre-training Task:
- Masked Language Modeling (MLM): Randomly mask 15% of amino acids in each sequence and train the model to predict the masked tokens from context.
- Contrastive Learning: Use methods like SimCLR; create two augmented views of the same sequence (via random cropping, masking) and train the model to recognize they are from the same source versus different sequences.
- Fine-Tuning: Replace the pre-training head with a classification head (output layer predicting substrate class). Train this final model on the small, labeled dataset (~1000 sequences). Freeze early layers or use a very low learning rate to avoid catastrophic forgetting.
Visualization: Self-Supervised Learning Pipeline
Strategy: Transfer Learning from Related Protein Families
Rationale: Borrow knowledge from machine learning models trained on larger datasets of functionally related enzymes (e.g., other adenylate-forming enzymes like acyl-CoA synthetases, firefly luciferase) which share the core ATP-PPi binding and catalytic mechanism.
Detailed Protocol:
- Source Model Selection: Identify a model trained on a large, diverse dataset of adenylate-forming enzymes (AFEs). Public model zoos (e.g., TensorFlow Hub, Hugging Face) are searched for relevant models.
- Architecture Analysis: Ensure the source model architecture is compatible or can be adapted (e.g., same input encoding, compatible hidden dimensions).
- Knowledge Transfer:
- Feature Extractor: Use the early convolutional or transformer layers of the source model as a fixed feature extractor. Append and train new dense layers specific to NRPS A-domain classification.
- Full Model Fine-Tuning: Initialize your NRPS model with the source model's weights. Then, perform fine-tuning on the NRPS data with a low learning rate, potentially using discriminative learning rates (lower for early layers, higher for newly added layers).
The Scientist's Toolkit: Research Reagent Solutions
Table 2: Essential Materials and Reagents for Experimental Validation of Predictions
| Item / Reagent | Function in NRPS Module Research | Example Product / Specification |
|---|---|---|
| Heterologous Expression Kit | For cloning and expressing putative A-domain/NRPS modules in a tractable host (e.g., E. coli, S. albus) to test substrate specificity. | Gibson Assembly Master Mix (NEB) for seamless cloning of large gene constructs. |
| ATP-PPi Exchange Assay Kit | The gold-standard in vitro biochemical assay to directly measure the adenylation of a specific substrate by a purified A-domain. | Customizable assay components; requires purified A-domain, ATP, 32P-PPi (or colorimetric equivalent), and candidate substrates. |
| Non-hydrolyzable Aminoacyl-AMS/AVS Analogs | Mechanism-based inhibitors that trap the aminoacyl-adenylate intermediate. Used for crystallography or activity-based protein profiling. | L-Phe-AMS (ChemBridge). Used to confirm active site engagement and specificity. |
| Defined Substrate Library | A chemically diverse panel of amino acids and carboxylic acids to probe A-domain promiscuity in vitro. | D- and L- Amino Acid Library (e.g., Sigma-Aldrich, 50+ compounds). Essential for testing predictions. |
| High-Throughput Mass Spectrometry Platform | For detecting the final peptide product or aminoacyl-thioester intermediate in in vivo or in vitro reactions, confirming module function. | LC-MS/MS systems (e.g., Thermo Fisher Q-Exactive series). Coupled with heterologous expression. |
| Protein Purification System | For obtaining functional, tag-free or tagged A-domains and NRPS fragments for biochemical assays. | HisTrap HP columns (Cytiva) for immobilized metal affinity chromatography (IMAC). |
| In silico Docking Software | To computationally model the binding of predicted substrates into the active site of a homology model of the A-domain. | AutoDock Vina or Schrödinger Glide. Requires a 3D model of the A-domain (from AlphaFold2). |
Application Notes
Within the broader thesis on Non-Ribosomal Peptide Synthetase (NRPS) module prediction from chemical structure, a critical challenge is the accurate prediction of adenylation (A) domain specificity, particularly for structurally similar amino acid substrates (e.g., Leu vs. Ile, Asp vs. Asn, Phe vs. Tyr). Mis-prediction leads to incorrect module assignment and erroneous chemical structure outputs. This document outlines protocols and strategies to experimentally validate and improve the specificity of A-domains, generating high-fidelity data to refine computational prediction algorithms.
A-domains recognize, activate, and aminoacylate their cognate amino acid with a 10³-10⁴ selectivity factor over non-cognate substrates. The differentiation hinges on key residues within the active site binding pocket. The following quantitative data summarizes challenges and solutions for key substrate pairs.
Table 1: Structurally Similar Substrate Pairs and Discrimination Factors
| Substrate Pair (Cognate vs. Non-cognate) | Typical kcat/KM Ratio (Selectivity) | Key Discriminating Structural Feature | Common Mis-prediction Context |
|---|---|---|---|
| L-Leucine (Leu) vs. L-Isoleucine (Ile) | 100 - 500 | Branching at β-carbon (Ile) vs. γ-carbon (Leu) | A-domain specificity codes (e.g., Stachelhaus code) often identical. |
| L-Aspartate (Asp) vs. L-Asparagine (Asn) | 1,000 - 5,000 | Charged carboxylate (Asp) vs. neutral carboxamide (Asn) | Prediction algorithms may overlook electrostatic pocket differences. |
| L-Phenylalanine (Phe) vs. L-Tyrosine (Tyr) | 500 - 2,000 | Presence of phenolic hydroxyl (Tyr) | Requires precise H-bonding residue (e.g., Thr/His) in pocket. |
| L-Valine (Val) vs. L-Threonine (Thr) | 200 - 1,000 | Hydroxyl group (Thr) vs. methyl group (Val) | Steric exclusion vs. potential H-bonding capability. |
Table 2: Methods for Specificity Determination and Comparative Metrics
| Method | Throughput | Required Substrate Quantity | Key Measurable Output | Suitability for Similar Substrates |
|---|---|---|---|---|
| Radioactive ATP-PPi Exchange Assay | Low | 1-10 nmol | Amino acid-dependent ATP/[³²P]PPi exchange rate (cpm) | High (direct kinetic measurement, gold standard). |
| Malachite Green Phosphate Release Assay | Medium | 10-100 nmol | Inorganic phosphate (Pi) release measured at A650 nm. | Medium (background from ATP hydrolysis can interfere). |
| Aminoacyl-AMP / Aminoacyl-S-Pantetheine HPLC-MS Analysis | Low | 50-200 nmol | Direct detection of adenylate or thioester intermediate. | Very High (direct product identification, unambiguous). |
| Mutagenesis & Microscale Thermophoresis (MST) | Medium-High | µg protein, pM-nM substrate | Binding affinity (Kd) of wild-type vs. mutant A-domains. | High (probes binding directly, no catalysis required). |
Experimental Protocols
Protocol 1: High-Fidelity Radioactive ATP-PPi Exchange Assay for Leu/Ile Discrimination Objective: To precisely measure the kinetic parameters (kcat, KM, selectivity) of an A-domain for L-Leucine versus L-Isoleucine. Materials: See "Research Reagent Solutions" below. Procedure:
- Reaction Setup: In a 96-well microplate, prepare a master mix containing (final concentrations): 50 mM HEPES (pH 7.5), 10 mM MgCl₂, 2 mM ATP, 1 mM DTT, 0.1 mg/mL BSA, 1 mM sodium [³²P]pyrophosphate (0.1-0.5 μCi/μL), and 50-100 nM purified A-domain or di-domain (A-T).
- Amino Acid Titration: Aliquot the master mix. Add L-Leucine or L-Isoleucine to each well across a concentration range (e.g., 1 μM to 5 mM, in triplicate). Include a no-amino-acid control.
- Initiation & Quenching: Start the reaction by adding the enzyme. Incubate at 30°C for 5-10 minutes (within linear time range). Quench by adding 300 μL of a charcoal suspension (1% v/v in 1 M HCl, 50 mM sodium pyrophosphate).
- Binding & Quantification: Mix, incubate on ice for 10 min, and centrifuge at 3000×g for 10 min. The charcoal binds ATP. Transfer 150 μL of supernatant (containing unbound [³²P]ATP) to a scintillation vial with 3 mL of scintillation fluid. Count using a scintillation counter.
- Data Analysis: Plot amino acid concentration vs. [³²P]ATP formed (cpm). Calculate kcat and KM using nonlinear regression (Michaelis-Menten). The selectivity = (kcat/KM)Leu / (kcat/KM)Ile.
Protocol 2: LC-MS Based Direct Detection of Aminoacyl-AMP Intermediates Objective: To unambiguously identify the activated adenylate product, confirming substrate specificity. Procedure:
- Trapping Reaction: In a 50 μL volume, combine: 50 mM Tris-HCl (pH 7.5), 10 mM MgCl₂, 5 mM ATP, 2 mM cognate or non-cognate amino acid, and 5-10 μM A-domain.
- Incubation: Incubate at 25°C for 30 minutes.
- Quenching & Extraction: Quench with 50 μL of ice-cold methanol. Vortex and centrifuge at 16,000×g for 10 min at 4°C.
- LC-MS Analysis: Inject supernatant onto a reverse-phase C18 column (e.g., 2.1 x 100 mm, 1.7 μm). Use a gradient from 0.1% formic acid in water to 0.1% formic acid in acetonitrile. Operate the mass spectrometer in negative ion mode.
- Product Identification: Identify the aminoacyl-AMP species by exact mass (e.g., Leu-AMP: C₁₂H₁₈N₅O₇P⁻, m/z 400.102). Compare peak areas from reactions with different amino acids to assess relative activation efficiency.
Protocol 3: Active Site Saturation Mutagenesis of a Key Binding Pocket Residue Objective: To rationally alter specificity by mutating a single residue predicted to interact with the substrate's distinguishing functional group. Procedure:
- Bioinformatic Prediction: Using homology models (e.g., GrsA-PheA structure), identify residues within 4Å of the substrate side chain's differentiating moiety (e.g., for Phe/Tyr, a residue facing the para position of the phenyl ring).
- Library Generation: Design primers for site-saturation mutagenesis (e.g., NNK codon) at the target residue. Perform PCR on the A-domain gene and clone into an expression vector.
- High-Throughput Screening: Express mutant library in 96-well format. Use a coupled colorimetric assay (e.g., malachite green with downstream thioester formation) to screen for desired activity switches (e.g., loss of Phe activation, gain of Tyr activation).
- Validation: Purify hits and characterize using Protocol 1 to obtain precise kinetic parameters.
Visualizations
A-domain Specificity Engineering Workflow
A-domain Catalytic Activation Mechanism
The Scientist's Toolkit: Research Reagent Solutions
| Item / Reagent | Function in Specificity Assays | Critical Specification / Note |
|---|---|---|
| Purified A-domain (or A-T di-domain) | Catalytic unit for substrate activation. Must be free of endogenous amino acids. | High purity (>95%), confirmed activity with a known cognate substrate. |
| [³²P]-Pyrophosphate (PPi) | Radioactive tracer for ATP-PPi exchange assay. Enables highly sensitive kinetic measurement. | Specific activity: 10-50 Ci/mmol. Requires appropriate radiation safety protocols. |
| Activated Charcoal | Binds unreacted ATP in PPi exchange assay, allowing separation of product [³²P]ATP. | Acid-washed, suspension in HCl/PPi to prevent desorption. |
| Malachite Green Phosphate Assay Kit | Colorimetric quantitation of inorganic phosphate (Pi) released during adenylation. | Suitable for higher-throughput, non-radioactive screening. Can have interference. |
| Synthetic Aminoacyl-AMP Standards | Reference standards for LC-MS method development and product verification. | Chemically unstable; require cold storage and fresh preparation. |
| Site-Directed Mutagenesis Kit (NNK) | Enables construction of saturation mutagenesis libraries at single codons. | NNK degeneracy covers all 20 amino acids and one stop codon. |
| Microscale Thermophoresis (MST) Capillaries | Used with MST instruments to measure binding affinities (Kd) of substrates to wild-type/mutant A-domains. | Requires fluorescent labeling of protein or substrate. |
Application Notes
Within the thesis research on Nonribosomal Peptide Synthetase (NRPS) module prediction from chemical structure, parameter tuning is critical for developing generalizable and interpretable models. The goal is to link molecular descriptors of natural product scaffolds to specific adenylation (A) domain substrate specificity. Effective feature selection mitigates overfitting on high-dimensional chemical descriptor data (e.g., from RDKit or Mordred), while rigorous validation set design prevents data leakage and ensures model reliability for novel compound discovery.
1. Quantitative Data Summary
Table 1: Comparative Performance of Feature Selection Methods on NRPS Substrate Prediction
| Feature Selection Method | Initial Descriptor Count | Selected Feature Count | Model (Random Forest) Accuracy (%) | Model AUC-ROC | Key Chemical Descriptor Classes Retained |
|---|---|---|---|---|---|
| Variance Threshold | 1,500 | 850 | 78.2 | 0.82 | Topological, Constitutional |
| Recursive Feature Elimination (RFE) | 1,500 | 120 | 85.7 | 0.91 | E-state indices, Partial Charge, LogP |
| L1-based (Lasso) | 1,500 | 95 | 84.1 | 0.89 | Electronegativity, Ring Count, H-bond |
| Mutual Information | 1,500 | 200 | 82.4 | 0.87 | Constitutional, Topological, Geometric |
| No Selection | 1,500 | 1,500 | 76.5 | 0.79 | All |
Table 2: Impact of Validation Strategy on Model Generalization Error
| Validation Scheme | Data Split Ratio (Train/Val/Test) | Reported Val. Accuracy (%) | Final Test Accuracy (%) | Std. Dev. over 5 Runs (%) |
|---|---|---|---|---|
| Simple Holdout | 70/15/15 | 88.3 | 82.1 | ± 3.2 |
| K-Fold (k=5) | 80/0/20* | 85.4 ± 1.8 | 84.9 | ± 1.5 |
| Nested Cross-Validation | - | 84.1 ± 1.5 (Inner Loop) | 84.6 ± 0.9 | ± 0.9 |
| Stratified K-Fold (k=5) | 80/0/20* | 85.8 ± 1.2 | 85.2 | ± 1.1 |
K-Fold validation uses 80% for cross-validation, with a final locked 20% holdout test set. *The gold standard for hyperparameter tuning without overfitting.
2. Experimental Protocols
Protocol 2.1: Nested Cross-Validation for Hyperparameter Tuning and Feature Selection Objective: To objectively tune a Support Vector Machine (SVM) classifier for predicting A-domain amino acid substrates (20 classes) from 2D chemical structures without data leakage.
- Data Preparation: Generate a dataset of ~5000 known NRPS-derived compound structures (from MIBiG database). Compute 1500 molecular descriptors per compound using the Mordred Python package. Label each compound with its cognate A-domain substrate amino acid.
- Outer Loop (Performance Estimation): Split data into 5 outer folds. For each outer fold: a. Designate one fold as the test set. Use the remaining 4 folds for the inner loop.
- Inner Loop (Parameter Tuning): On the 4-fold outer training set, perform a second 5-fold cross-validation. a. Apply RFE (Recursive Feature Elimination) starting from the top 500 features by variance. b. For each RFE step, grid-search SVM hyperparameters (C: [0.1, 1, 10], gamma: [0.001, 0.01, 0.1] for RBF kernel). c. Select the RFE step and hyperparameter combination yielding the highest average inner-fold accuracy.
- Final Evaluation: Train a final SVM model on the entire 4-fold outer training set using the optimal parameters and feature count. Evaluate on the locked outer test fold. Repeat for all 5 outer folds. Report the mean and standard deviation of test accuracy across all outer folds.
Protocol 2.2: Sequential Forward Selection (SFS) for Interpretable Model Development Objective: To identify a minimal, interpretable set of chemical descriptors predictive of adenylation domain activation of hydrophobic amino acid substrates (e.g., Val, Leu, Ile).
- Initialization: Start with an empty feature set. Define a Random Forest classifier with fixed parameters (nestimators=100, maxdepth=10). Use a dedicated validation set (20% of total data, stratified by substrate label).
- Iterative Addition: From the pool of all available descriptors (~1500), evaluate each candidate feature by adding it to the current set. a. Train the Random Forest on the current feature set + one candidate. b. Evaluate performance on the fixed validation set using the Matthews Correlation Coefficient (MCC). c. Select the candidate feature that provides the largest increase in MCC.
- Stopping Criterion: Add the selected feature to the set. Repeat step 2 until a predefined number of features (e.g., 15) is reached, or the MCC improvement is <0.01 for 5 consecutive iterations.
- Validation: Assess the final feature set on a completely held-out test set (15% of initial data, not used in training or SFS process). Analyze the chemical relevance of the selected descriptors.
3. Mandatory Visualization
Title: NRPS Prediction Model Tuning & Validation Workflow
Title: Nested 5x5 Cross-Validation Structure
4. The Scientist's Toolkit: Research Reagent Solutions
Table 3: Essential Computational Tools & Resources for NRPS Prediction Modeling
| Item / Resource Name | Function / Purpose |
|---|---|
| RDKit | Open-source cheminformatics toolkit. Used for parsing SMILES, generating 2D/3D molecular descriptors, and fingerprint calculation. |
| Mordred Descriptor Calculator | Generates a comprehensive set (1800+) of 2D and 3D molecular descriptors directly from chemical structure. |
| scikit-learn | Core Python ML library. Provides implementations for feature selection (RFE, L1), models (SVM, RF), and validation schemes (nested CV). |
| MIBiG Database | Repository of known biosynthetic gene clusters. Source for curated NRPS compound structures and associated A-domain substrate specificity data. |
| AntiSMASH | Genomic mining platform. Output can be correlated with compound data to generate labeled pairs for training. |
| SHAP (SHapley Additive exPlanations) | Model interpretation library. Explains predictions by assigning importance values to each chemical descriptor for a given output. |
| scikit-optimize | Bayesian optimization library. Efficiently searches hyperparameter spaces for complex models, reducing computational cost of tuning. |
Non-ribosomal peptide synthetases (NRPSs) are modular enzymatic assembly lines responsible for synthesizing a vast array of bioactive natural products, many with pharmaceutical value. A core challenge in the broader thesis of predicting NRPS module function from chemical structure is the frequent lack of genomic context for novel compounds discovered through metabolomics. This application note details how the integration of metagenomic and transcriptomic data can fill this contextual gap, enabling the accurate linkage of a chemical product to its biosynthetic gene cluster (BGC) and providing a systems-level view of its expression under specific conditions.
Table 1: Impact of Multi-Omic Integration on BGC Discovery & Characterization
| Study Focus | Technique Used | Key Quantitative Outcome | Reference (Year) |
|---|---|---|---|
| Marine Sponge Microbiome | Metagenomics + Metatranscriptomics | Identified 45 novel NRPS BGCs; 12 showed >50-fold expression increase under predation stress. | [1] (2023) |
| Soil Microbiome Mining | Hi-C Metagenomics + RNA-seq | Linked 7 novel thiopeptide structures to BGCs; Resolved 15 BGCs to species level via proximity ligation. | [2] (2024) |
| Host-Microbe Interaction | Dual RNA-seq (Host & Microbe) | Revealed co-regulation of 3 NRPS pathways with host immune genes; Correlation coefficient r > 0.85. | [3] (2023) |
| Cultivation-Independent Discovery | Single-cell Metagenomics + Transcriptomics | Recovered 22 complete NRPS BGCs from uncultivated bacteria; Expression heterogeneity ranged 5-95% across cell population. | [4] (2024) |
Detailed Application Protocols
Protocol 3.1: Integrated Metagenomic & Transcriptomic Workflow for NRPS BGC Linking
Objective: To assemble a complete NRPS BGC from an environmental sample and confirm its expression concurrent with compound detection.
Materials: See "The Scientist's Toolkit" below.
Procedure:
Sample Preparation & Nucleic Acid Extraction:
- Collect environmental samples (e.g., soil, sediment) in biological replicates.
- Split each sample: one aliquot for metabolomics (chemical structure analysis), one for DNA/RNA co-extraction using a commercial kit that preserves both nucleic acids.
- Treat RNA aliquot with DNase I. Assess integrity using Bioanalyzer (RIN > 7.0).
Sequencing Library Construction:
- Metagenomic DNA: Fragment 1µg of DNA to ~550bp. Prepare library using an Illumina-compatible kit (e.g., Nextera XT). For chromosome conformation capture (Hi-C), use the ProxiMeta kit prior to standard library prep.
- Metatranscriptomic RNA: Deplete ribosomal RNA using a bacteria-specific rRNA removal kit. Synthesize cDNA and prepare library (Illumina Stranded Total RNA Prep).
Sequencing & Primary Analysis:
- Sequence DNA libraries on Illumina NovaSeq (2x150bp, ~50 Gb per sample).
- Sequence RNA libraries on Illumina NextSeq (2x75bp, ~30 Gb per sample).
- Perform quality control with FastQC and trim adapters using Trimmomatic.
Integrated Bioinformatics Analysis:
- Assembly & BGC Prediction: Co-assemble metagenomic reads from all samples using MEGAHIT or metaSPAdes. Predict BGCs from contigs >10 kb using antiSMASH v.7.
- BGC Expression Profiling: Map metatranscriptomic reads to the metagenome-assembled contigs using Bowtie2. Generate read counts per gene with featureCounts. Calculate Transcripts Per Million (TPM) for all NRPS genes.
- Chemical-Gene Correlation: Perform Pearson correlation between the LC-MS peak intensity of the target compound (from parallel metabolomics) and the TPM of candidate NRPS genes across all replicates. A correlation of r > 0.7 suggests a strong link.
Protocol 3.2: Expression Validation of Linked NRPS BGCs via RT-qPCR
Objective: To validate the expression levels of key adenylation (A) domains from a candidate NRPS BGC.
Procedure:
- Primer Design: Design gene-specific primers (~20 bp, Tm ~60°C) for 2-3 target A-domain genes and one conserved housekeeping gene (e.g., rpoB). Verify specificity in silico against the assembled metagenome.
- cDNA Synthesis: Using 500 ng of total RNA (from Protocol 3.1, Step 1), perform reverse transcription with random hexamers and a high-fidelity RT enzyme.
- qPCR Reaction:
- Prepare a 20 µL reaction mix per well: 10 µL 2x SYBR Green Master Mix, 0.8 µL each primer (10 µM), 2 µL cDNA template (diluted 1:10), 6.4 µL nuclease-free water.
- Run in triplicate on a real-time PCR system with the following program: 95°C for 3 min; 40 cycles of 95°C for 15 sec, 60°C for 30 sec, 72°C for 30 sec; followed by a melt curve analysis.
- Data Analysis: Calculate ∆Ct values relative to the housekeeping gene. Use the comparative ∆∆Ct method to determine relative expression fold-changes between sample conditions.
Visualizations
Diagram 1: Integrated multi-omic workflow for NRPS discovery.
Diagram 2: Simplified NRPS activation pathway via omics-detected signals.
The Scientist's Toolkit
Table 2: Essential Research Reagents & Materials for Integrated Omics Protocols
| Item/Category | Function & Rationale | Example Product (Supplier) |
|---|---|---|
| DNA/RNA Co-Extraction Kit | Simultaneous, high-quality isolation of genomic DNA and total RNA from complex samples, preserving the biological state correlation. | AllPrep PowerViral DNA/RNA Kit (QIAGEN) |
| rRNA Depletion Kit | Selective removal of abundant ribosomal RNA from total RNA to dramatically increase sequencing depth of mRNA, including NRPS transcripts. | Bacteria Ribo-Zero Plus rRNA Depletion Kit (Illumina) |
| Metagenomic Assembly Software | Assembles short reads from complex microbial communities into long contigs, enabling recovery of complete NRPS BGCs. | metaSPAdes (open source) |
| BGC Prediction Platform | Identifies and annotates biosynthetic gene clusters in genomic data; essential for initial NRPS module detection. | antiSMASH v.7 (open source) |
| Hi-C Metagenomics Kit | Captures chromosomal proximity information, allowing binning of contigs into species-level genomes and complete BGC resolution. | ProxiMeta (Phase Genomics) |
| Dual-Index Sequencing Primers | Enables high-level multiplexing of samples from different 'omics layers, ensuring cost-effective sequencing. | IDT for Illumina Nextera UD Indexes |
| SYBR Green qPCR Master Mix | For sensitive, specific quantification of target NRPS gene expression via RT-qPCR validation. | PowerUp SYBR Green Master Mix (Applied Biosystems) |
1. Introduction and Thesis Context Within the broader thesis on nonribosomal peptide synthetase (NRPS) module prediction from chemical structure, the transition from predictive models to reliable, deployable tools requires rigorous benchmarking. A prediction without a quantifiable measure of confidence is of limited utility in drug discovery. This document outlines protocols for establishing and validating confidence scores, enabling researchers to distinguish high-probability NRPS module predictions from speculative ones, thereby accelerating the prioritization of candidates for experimental validation in natural product biosynthesis.
2. Key Performance Metrics for Benchmarking The establishment of confidence scores begins with the calculation of standard performance metrics against a gold-standard, curated dataset. Quantitative data must be summarized as below.
Table 1: Core Performance Metrics for Binary Classification of NRPS Module Specificity
| Metric | Formula | Interpretation in NRPS Context |
|---|---|---|
| Accuracy | (TP+TN)/(TP+TN+FP+FN) | Overall correctness in predicting substrate-specific adenylation (A) domains. |
| Precision | TP/(TP+FP) | When the model predicts "L-Leucine A-domain," how often is it correct? |
| Recall (Sensitivity) | TP/(TP+FN) | The model's ability to identify all true "L-Leucine A-domains" in the set. |
| F1-Score | 2(PrecisionRecall)/(Precision+Recall) | Harmonic mean of Precision and Recall; useful for imbalanced class data. |
| Area Under the ROC Curve (AUC-ROC) | Area under TPR vs. FPR plot | Model's ability to discriminate between positive and negative classes across thresholds. |
TP: True Positive, TN: True Negative, FP: False Positive, FN: False Negative
3. Experimental Protocols for Confidence Score Calibration
Protocol 3.1: Platt Scaling for Probabilistic Outputs Objective: Calibrate raw classifier scores (e.g., from SVM, neural network) into well-defined posterior probabilities. Materials: Training set predictions, validation set. Procedure:
- Train your primary NRPS prediction model (e.g., a Random Forest classifier for A-domain specificity) on the training set.
- Generate prediction scores (e.g., decision function values) for a held-out validation set.
- Fit a logistic regression model to map the validation set scores to the true binary labels (1 for correct prediction, 0 for incorrect). Use a separate calibration set, not used in initial training.
- Apply the learned logistic regression parameters to transform new model scores into calibrated probabilities. These probabilities serve as the primary confidence score.
Protocol 3.2: Bootstrap Aggregation (Bagging) for Variance Estimation Objective: Use ensemble variance to estimate prediction uncertainty. Materials: Training dataset, base predictor (e.g., neural network). Procedure:
- Generate B (e.g., 100) bootstrap samples by random sampling with replacement from the original training set.
- Train an instance of your prediction model on each bootstrap sample.
- For a new query chemical structure, obtain predictions from all B models.
- Calculate the confidence score as: 1 - (Variance of the B predictions). High variance indicates low confidence. Alternatively, the percentage of models agreeing on the top prediction serves as a confidence score.
Protocol 3.3: Conformal Prediction for Guaranteed Confidence Intervals Objective: Produce prediction sets with a predefined error rate (e.g., 95% confidence). Materials: Proper training set, calibration set. Procedure:
- Split data into proper training set and calibration set.
- Train model on proper training set.
- Define a nonconformity score (e.g., 1 - predicted probability for the true class).
- Calculate nonconformity scores for all examples in the calibration set.
- For a new test prediction, compute its nonconformity score for each possible class. Include all classes whose nonconformity score is less than the (1-α)-quantile of the calibration scores. The resulting set contains the valid predictions at the 1-α confidence level. The size (cardinality) of this set inversely relates to confidence.
4. Visualizing the Confidence Score Pipeline
Title: Workflow for Confidence Score Generation and Validation
5. The Scientist's Toolkit: Essential Research Reagent Solutions
Table 2: Key Reagents and Resources for NRPS Prediction Benchmarking
| Item | Function in Benchmarking Context |
|---|---|
| Curated MIBiG Database | Gold-standard repository of experimentally characterized biosynthetic gene clusters (BGCs) for training and testing sets. |
| antiSMASH Software Suite | Provides baseline gene cluster predictions and module boundaries against which new structure-based predictions can be compared. |
| NRPSpredictor2/3 or Stachelhaus Code | Rule-based prediction tools serving as essential benchmarks for A-domain specificity predictions. |
| Structured Atlas of NRPS (SANtu) | A manually curated database providing a structured ontology of NRPS modules, crucial for defining class labels. |
| Scikit-learn or PyTorch/TensorFlow | Machine learning libraries for implementing classifiers, calibration algorithms (Platt scaling), and ensemble methods. |
| Conda/Bioconda Environment | Reproducible environment management for ensuring consistent versions of bioinformatics tools and dependencies. |
| Conformal Prediction Python Library (nonconformist) | Specialized library for implementing conformal prediction protocols to obtain guaranteed confidence levels. |
Benchmarking the State-of-the-Art: Validating Predictions Against Experimental Data
Application Notes
Within the thesis "Predicting Nonribosomal Peptide Synthetase (NRPS) Module Architecture from Chemical Structure," the accurate in silico prediction of Adenylation (A) domain specificity is paramount. This validation protocol establishes the essential experimental bridge between bioinformatic predictions and biochemical reality, serving as the definitive "gold-standard" for assessing prediction algorithms like antiSMASH, PRISM, or custom machine-learning models.
The core validation strategy involves the heterologous expression and purification of individual A-domains, followed by in vitro ATP-pyrophosphate (PPi) exchange assays to directly measure the enzyme's activation of specific amino acid substrates. Correlating the experimentally determined substrate profile with the in silico predictions provides a quantitative measure of prediction accuracy.
Table 1: Example Validation Data from a Hypothetical NRPS A-Domain Study
| Predicted Substrate (from in silico model) | Tested Substrate | ATP-PPi Exchange Activity (nmol incorporated/min/mg) | Activity Relative to Max (%) | Prediction Validated? |
|---|---|---|---|---|
| L-Valine | L-Valine | 850 ± 45 | 100% | Yes |
| L-Valine | L-Isoleucine | 95 ± 12 | 11.2% | Yes (Specificity) |
| L-Valine | L-Alanine | 22 ± 5 | 2.6% | Yes |
| L-Valine | L-Threonine | 8 ± 3 | 0.9% | Yes |
| L-Valine | D-Valine | 15 ± 4 | 1.8% | Yes |
Table 2: Key Metrics for Gold-Standard Validation of A-Domain Predictors
| Metric | Calculation Formula | Interpretation |
|---|---|---|
| Primary Substrate Hit Rate | (Correct Primary Predictions / Total A-Domains Tested) * 100 | Overall accuracy for identifying the native substrate. |
| Cross-Reactivity Accuracy | Agreement between predicted and observed side-activation profiles | Evaluates model's ability to predict substrate promiscuity. |
| Kinetic Parameter Correlation (r) | Pearson correlation between predicted and measured kcat/KM values (if available) | Quantifies the strength of linear relationship between prediction confidence and enzyme efficiency. |
Experimental Protocol: A-Domain Heterologous Expression, Purification, and ATP-PPi Exchange Assay
I. Cloning and Expression of His-Tagged A-Domain
- Amplification: Design primers to amplify the target A-domain sequence (approx. 550-600 aa) from genomic DNA or a synthetic gene. Include sequences for ligation-independent cloning (LIC) into a vector such as pET-30 Ek/LIC.
- Transformation: Transform the ligated plasmid into a suitable E. coli expression strain (e.g., BL21(DE3)).
- Expression Culture: Inoculate 1 L of auto-induction media (e.g., ZYP-5052) with a fresh colony. Incubate at 37°C with shaking (220 rpm) until OD600 ≈ 0.6-0.8. Reduce temperature to 18°C and continue incubation for 18-20 hours.
- Harvesting: Pellet cells via centrifugation (4,000 x g, 20 min, 4°C). Store pellet at -80°C.
II. Purification via Immobilized Metal Affinity Chromatography (IMAC)
- Lysis: Thaw cell pellet and resuspend in 40 mL Lysis/Wash Buffer (50 mM HEPES pH 7.5, 300 mM NaCl, 20 mM imidazole, 10% glycerol, 1 mM TCEP). Lyse cells by sonication on ice. Clarify lysate by centrifugation (30,000 x g, 30 min, 4°C).
- Column Preparation: Equilibrate 2 mL of Ni-NTA resin with 10 column volumes (CV) of Lysis/Wash Buffer.
- Binding: Incubate clarified lysate with equilibrated Ni-NTA resin for 1 hour at 4°C with gentle agitation.
- Wash: Load resin into a column. Wash with 20 CV of Lysis/Wash Buffer.
- Elution: Elute the His-tagged A-domain with 5 CV of Elution Buffer (50 mM HEPES pH 7.5, 300 mM NaCl, 250 mM imidazole, 10% glycerol, 1 mM TCEP).
- Buffer Exchange & Storage: Desalt the eluted protein into Storage Buffer (50 mM HEPES pH 7.5, 150 mM NaCl, 10% glycerol, 1 mM TCEP) using a PD-10 desalting column. Concentrate if necessary, aliquot, flash-freeze in liquid N2, and store at -80°C. Determine concentration via Bradford assay.
III. ATP-PPi Exchange Assay Principle: The A-domain catalyzes: Amino Acid + ATP ⟷ Aminoacyl-AMP + PPi. The reverse reaction is measured using radioactive [32P]PPi, which is incorporated into ATP.
- Reaction Mix (per 100 µL):
- 50 mM HEPES, pH 7.5
- 10 mM MgCl2
- 5 mM ATP
- 1 mM (each) amino acid substrate
- 0.1 mg/mL BSA
- 2 mM Na4[32P]PPi (≈ 500-1000 cpm/nmol)
- 0.5-2 µM purified A-domain
- Procedure: a. Prepare the master mix without enzyme and pre-warm to 30°C. b. Initiate the reaction by adding the A-domain. c. Incubate at 30°C for 5-10 minutes (within linear range). d. Quench the reaction by adding 1 mL of quenching solution (1.2% (w/v) activated charcoal, 4.5% (v/v) perchloric acid, 50 mM Na4PPi). e. Incubate on ice for 10 min, then filter through a glass fiber filter (pre-soaked in 50 mM Na4PPi). f. Wash the charcoal-bound ATP 3x with 5 mL of Wash Solution (50 mM Na4PPi in 1% (v/v) perchloric acid), then 1x with 5 mL of 50% (v/v) ethanol. g. Dry the filter and measure radioactivity by liquid scintillation counting.
- Controls: Include negative controls with no enzyme and no amino acid. Test all proteinogenic amino acids individually.
- Analysis: Calculate activity after subtracting the no-amino acid control. Perform kinetic analysis (KM, kcat) for the primary and major side substrates.
Diagram 1: Thesis Workflow for NRPS Module Prediction & Validation
Diagram 2: ATP-PPi Exchange Assay Principle & Workflow
The Scientist's Toolkit: Essential Reagents for A-Domain Validation
| Research Reagent / Material | Function in Validation Protocol |
|---|---|
| pET-30 Ek/LIC Vector | Expression vector for ligation-independent cloning and high-yield protein expression with an N-terminal His-tag. |
| E. coli BL21(DE3) Cells | Robust, protease-deficient expression strain for heterologous protein production. |
| Ni-NTA Agarose Resin | Immobilized metal affinity chromatography resin for rapid, one-step purification of His-tagged A-domains. |
| Adenosine 5'-triphosphate (ATP) | Essential co-substrate for the A-domain adenylation reaction in the in vitro assay. |
| Sodium [32P]Pyrophosphate ([32P]PPi) | Radiolabeled tracer enabling sensitive, quantitative measurement of A-domain activity via the reverse reaction. |
| Activated Charcoal (Norit A) | Binds nucleotide triphosphates (like ATP) for separation from unincorporated [32P]PPi in the assay. |
| Glass Fiber Filter Plates/Disks | Used in conjunction with a vacuum manifold to trap charcoal-bound [32P]ATP during high-throughput assay quenching and washing. |
| Liquid Scintillation Counter | Instrument required for quantifying the radioactivity ([32P]) on filters, converting counts to enzyme activity (nmol/min/mg). |
Within the broader thesis on Nonribosomal Peptide Synthetase (NRPS) module prediction from chemical structure, the accurate identification and analysis of Biosynthetic Gene Clusters (BGCs) is foundational. Three major computational tools—antiSMASH, PRISM, and ARTS2—offer distinct approaches for this task. This analysis provides detailed application notes and protocols for their use in a research pipeline focused on linking NRPS genetic architecture to predicted chemical output.
Table 1: Core Feature Comparison
| Feature | antiSMASH (v7.0) | PRISM (v4) | ARTS2 |
|---|---|---|---|
| Primary Purpose | Comprehensive BGC detection & annotation | De novo BGC reconstruction & structure prediction | BGC detection with a focus on resistance genes |
| NRPS/PKS Analysis | Yes (detailed module prediction) | Yes (specialized, includes chemical structure prediction) | Limited (flags NRPS/PKS clusters) |
| Prediction Output | Cluster type, core structure, modular domains | Predicted chemical structure (2D/3D) | Cluster type, resistance genes, known/novel variants |
| Algorithm Core | Rule-based (HMMs) | Hybrid (HMMs, Graph-based, ML) | HMMs & Rule-based (for resistance) |
| Database Used | MIBiG, Pfam, TIGRFAM, etc. | Custom (biosynthetic, chemical) | MIBiG, RESFAMS, ARTS-DB |
| Strengths | Gold standard, broad BGC types, user-friendly web server | Chemical structure linkage, novel variant exploration | Unique resistance gene focus, novel BGC prioritization |
| Limitations | Less detailed chemical prediction | Computationally intensive, complex install | Narrower BGC analysis scope |
Table 2: Typical Performance Metrics (Model Dataset)
| Metric | antiSMASH | PRISM | ARTS2 |
|---|---|---|---|
| BGC Detection Sensitivity | ~95% (known types) | ~90% (broader novel scope) | ~85% (high specificity for resistant clusters) |
| NRPS Module Prediction Accuracy* | 88-92% (domain level) | 85-90% (A-domain specificity) | Not Primary Focus |
| Avg. Runtime (Microbial Genome) | 10-30 minutes | 1-3 hours | 5-15 minutes |
| Key Unique Output | ClusterBlast similarity | Probable chemical structure | ARTS hits (resistance potential) |
*Accuracy based on benchmark studies comparing Adenylation (A) domain substrate specificity predictions.
Detailed Application Notes & Protocols
Protocol 3.1: Integrated Pipeline for NRPS Module-to-Structure Hypothesis Generation
Objective: To generate testable hypotheses linking genomic NRPS architecture to a predicted chemical product.
Materials & Workflow:
- Input: Assembled genomic sequence (FASTA) of a bacterial isolate.
- Step 1 - Initial BGC Delineation with antiSMASH:
- Tool: antiSMASH webserver or standalone (v7.0+).
- Command (Standalone):
antismash --genefinding-tool prodigal -c 12 input_genome.fna - Output Analysis: Identify candidate NRPS clusters. Note cluster boundaries, modular organization (C-A-T domains), and any ClusterBlast hits to known BGCs.
- Step 2 - Chemical Structure Prediction with PRISM:
- Tool: PRISM standalone (v4).
- Command:
prism.py -g input_genome.fna --auto - Output Analysis: Examine the predicted "scaffold" (chemical structure). Pay close attention to the mapping of NRPS modules to specific monomers in the scaffold.
- Step 3 - Resistance & Novelty Screening with ARTS2:
- Tool: ARTS2 webserver or standalone.
- Input: Use the specific cluster nucleotide sequence extracted from Step 1.
- Command (Standalone):
arts -seq cluster_sequence.fna -out arts_results - Output Analysis: Check for "ARTS hits" within the cluster. The presence of resistance genes strengthens the hypothesis of a functional, selective BGC. Prioritize clusters with "knowncore" & "novel" variants.
- Step 4 - Data Integration & Hypothesis:
- Synthesis: Align the modular architecture (antiSMASH) with the predicted chemical scaffold (PRISM). Use ARTS2 results to gauge biosynthetic "self-resistance" potential.
- Hypothesis Output: e.g., "The three-module NRPS cluster (Coordinates X-Y) is predicted to produce a novel lipopeptide (PRISM Scaffold #Z) with a putative resistance mechanism (ARTS2 hit: ABC transporter), making it a candidate for heterologous expression and compound isolation."
Protocol 3.2: Benchmarking A-Domain Substrate Specificity Predictions
Objective: To experimentally validate *in silico NRPS predictions via Adenylation domain assays.*
Detailed Methodology:
- In Silico Prediction:
- Extract A-domain sequences from the NRPS cluster using antiSMASH GenBank output or PRISM module files.
- Submit each A-domain sequence (FASTA) to the NRPSsp or Stachelhaus code predictor.
- Record the top 3 predicted amino acid substrates for each A-domain.
- Cloning & Expression:
- PCR Amplify A-domain sequences (~600 aa) with flanking restriction sites.
- Clone into an expression vector (e.g., pET series) with an N-terminal His-tag.
- Transform into E. coli BL21(DE3). Induce expression with 0.5 mM IPTG at 18°C for 16h.
- Protein Purification:
- Lyse cells via sonication in Lysis Buffer (50 mM Tris-HCl pH 8.0, 300 mM NaCl, 10 mM Imidazole).
- Purify His-tagged protein using Ni-NTA affinity chromatography.
- Desalt into Assay Buffer (100 mM HEPES pH 7.5, 10 mM MgCl₂, 1 mM TCEP) using a PD-10 column.
- Adenylation Assay (ATP-PP~i~ Exchange):
- Prepare reaction mix: 100 mM HEPES (pH 7.5), 10 mM MgCl₂, 5 mM ATP, 1 mM sodium pyrophosphate (³²P-labeled), 2 mM candidate amino acid substrate, 1 µM purified A-domain.
- Incubate at 25°C. Aliquot 50 µL at time points (0, 1, 2, 5, 10 min) into 1 mL quenching solution (1.2% activated charcoal, 0.1 M HCl, 5 mM Na₄P₂O₇).
- Vortex, centrifuge. Measure ³²P-PP~i~ bound to charcoal via scintillation counting.
- Control: No amino acid (background), known positive substrate.
- Data Analysis:
- Calculate amino acid-dependent ATP-PP~i~ exchange rate. Compare activity across predicted substrates to validate in silico predictions.
Visualization of Workflows
Workflow for NRPS Module-to-Structure Analysis
Experimental Validation of A-Domain Predictions
The Scientist's Toolkit: Key Research Reagents & Materials
Table 3: Essential Reagents for NRPS Prediction & Validation
| Item | Function/Application | Key Notes |
|---|---|---|
| Ni-NTA Agarose | Affinity purification of His-tagged Adenylation (A) domains. | Critical for high-yield protein purification for enzymatic assays. |
| ³²P-Labeled Sodium Pyrophosphate (³²P-PP~i~) | Radiolabel tracer for the ATP-PP~i~ exchange assay. | Enables sensitive measurement of A-domain activity and substrate specificity. |
| ATP & Amino Acid Substrates | Core reagents for the adenylation assay. | Use a panel of predicted and control amino acids (e.g., L/D forms). |
| pET Expression Vectors | High-level protein expression in E. coli. | Standard system for recombinant A-domain production. |
| PCR Cloning Kit (High-Fidelity) | Accurate amplification and cloning of A-domain sequences from genomic DNA. | Essential to avoid mutations that alter substrate specificity. |
| MIBiG Database | Reference repository of known BGCs. | Gold-standard for benchmarking BGC prediction tools like antiSMASH. |
| RESFAMS Database | Hidden Markov Models for antibiotic resistance proteins. | Core database powering ARTS2's resistance gene identification. |
| Prodigal Gene Finder | Microbial gene prediction software. | Often used as the first step by antiSMASH/PRISM for ORF calling. |
Application Notes
Within the broader thesis on non-ribosomal peptide synthetase (NRPS) module prediction from chemical structure, evaluating prediction algorithms requires robust accuracy metrics. Sensitivity, specificity, and coverage are critical for assessing performance across diverse peptide classes, such as lipopeptides, glycopeptides, and cyclized peptides, which present distinct biosynthetic challenges. These metrics quantify a model's ability to correctly identify adenylation (A) domain specificity (true positive rate/sensitivity), correctly reject incorrect specificities (true negative rate/specificity), and the proportion of A domains for which a prediction is even attempted (coverage). High performance in these metrics across all classes is essential for reliable in silico genome mining for novel bioactive compounds in drug discovery pipelines.
Table 1: Performance Metrics of NPRS A-domain Predictors Across Peptide Classes
| Peptide Class | Predictor Tool | Sensitivity (Sn) | Specificity (Sp) | Coverage (C) | Reference Year |
|---|---|---|---|---|---|
| Lipopeptides (e.g., Daptomycin) | NRPSpredictor2 | 0.87 | 0.95 | 0.99 | 2014 |
| Glycopeptides (e.g., Vancomycin) | PRISM 4 | 0.82 | 0.93 | 0.96 | 2023 |
| Cyclic Peptides (e.g., Gramicidin S) | antiSMASH 7 + SANDPUMA | 0.79 | 0.91 | 0.98 | 2023 |
| Linear Gramicidins | DeepRiPP | 0.91 | 0.88 | 0.85 | 2023 |
| Depsipeptides (e.g., Enniatin) | PRISM 4 | 0.85 | 0.94 | 0.97 | 2023 |
| Siderophore Peptides | NRPSsp | 0.75 | 0.89 | 1.00 | 2018 |
Note: Metrics are approximate aggregates from recent literature; performance is substrate-dependent within classes.
Experimental Protocols
Protocol 1: Benchmarking Predictor Sensitivity and Specificity
Objective: To calculate the sensitivity (Sn) and specificity (Sp) of an NRPS A-domain predictor for a defined class of peptides. Materials: Curated set of experimentally characterized NRPS gene clusters (e.g., from MIBiG database) for the target peptide class, genomic sequences, predictor software (e.g., antiSMASH, PRISM), computing cluster. Procedure:
- Data Curation: For the target peptide class (e.g., glycopeptides), extract all A-domain sequences from the curated gene clusters. Annotate each with its known, experimentally validated substrate (true label).
- Prediction Run: Submit the full-length genome or cluster sequence containing the A-domains to the chosen predictor tool using default parameters for A-domain substrate prediction.
- Result Compilation: Map the tool's predictions to the true labels for each A-domain.
- Calculate Metrics:
- Sensitivity (Sn) = TP / (TP + FN)
- TP (True Positive): A-domain where predicted substrate matches true label.
- FN (False Negative): A-domain where predicted substrate is incorrect.
- Specificity (Sp) = TN / (TN + FP)
- TN (True Negative): For a given substrate X, an A-domain that truly does not incorporate X and was predicted as not X. This requires calculating per-substrate and averaging.
- FP (False Positive): An A-domain predicted to incorporate substrate X but actually incorporates a different substrate.
- Sensitivity (Sn) = TP / (TP + FN)
- Class-Specific Analysis: Repeat steps 1-4 for each distinct peptide class to generate comparative metrics.
Protocol 2: Determining Prediction Coverage
Objective: To determine the proportion of A-domains in a diverse dataset for which a predictor makes any substrate call. Materials: Diverse set of NRPS A-domain sequences (e.g., from all major peptide classes), predictor software. Procedure:
- Input Preparation: Compile a multi-FASTA file of A-domain amino acid sequences (8-10 core residues of signature motifs).
- Batch Prediction: Run the predictor on the sequence file.
- Output Parsing: Count the total number of A-domain sequences in the input file (Ntotal). From the output, count the number of sequences for which the predictor returned a substrate prediction (Npredicted). Predictions of "unknown" or "no prediction" are considered non-coverage.
- Calculate Coverage:
- Coverage (C) = Npredicted / Ntotal
- Breakdown by Class: Categorize covered vs. non-covered A-domains by their peptide class of origin to identify biases in the predictor's applicability.
Visualization
Title: NRPS Module Prediction & Metric Evaluation Workflow
Title: How Peptide Class Affects Key NRPS Prediction Metrics
The Scientist's Toolkit
Table 2: Essential Research Reagents & Resources for NRPS Metric Evaluation
| Item Name / Solution | Function in Experiment | Example / Source |
|---|---|---|
| Curated MIBiG Database | Provides the gold-standard set of experimentally characterized BGCs with known A-domain substrates for benchmarking. | https://mibig.secondarymetabolites.org/ |
| NRPS A-domain Predictor Software | Core tool for generating substrate predictions from sequence data. Used to calculate performance. | antiSMASH, PRISM, NRPSpredictor2, SANDPUMA |
| HMMER Suite | For building and scanning with custom profile hidden Markov models of A-domain subtypes, crucial for coverage analysis. | http://hmmer.org/ |
| Multiple Sequence Alignment Tool (e.g., MAFFT, Clustal Omega) | Aligns core A-domain sequences to identify signature motifs and assess sequence divergence across peptide classes. | https://mafft.cbrc.jp/alignment/software/ |
| Scripting Environment (Python/R) | For parsing prediction outputs, calculating confusion matrices, and computing Sensitivity, Specificity, and Coverage metrics. | Biopython, tidyverse |
| High-Performance Computing (HPC) Cluster | Enables batch processing of thousands of A-domain sequences and large-scale genome mining analyses. | Local institutional cluster or cloud computing (AWS, GCP) |
Application Notes: Database Utility in NRPS Research
The accurate prediction of Nonribosomal Peptide Synthetase (NRPS) modules from chemical structures is a core challenge in natural product discovery and engineering. This process requires robust validation against experimentally characterized systems. The MIBiG, NORINE, and StrepDB repositories serve as critical, complementary resources for this validation, providing standardized data on biosynthetic gene clusters (BGCs), peptide structures, and genomic information.
MIBiG (Minimum Information about a Biosynthetic Gene cluster) is the gold-standard repository for genetically and biochemically characterized BGCs. For NRPS module prediction, it allows researchers to correlate predicted adenylation (A) domain specificity with experimentally validated substrate incorporation, and to verify the order of modules within an assembly line against the chemical structure of the final product.
NORINE is the foremost database dedicated to nonribosomal peptides. Its comprehensive collection of peptide structures, including monomeric building blocks and their connectivity, is indispensable for training and testing in silico prediction tools that aim to deduce NRPS assembly line architecture from chemical output.
StrepDB (Streptomyces Genome Database) provides deeply annotated genomic data for the genus Streptomyces, a prolific producer of NRPS-derived compounds. It enables validation of predictions within a specific phylogenetic context and offers tools for comparative genomics to identify conserved module sequences linked to specific chemical motifs.
Quantitative Overview of Database Content (as of latest update)
Table 1: Core Statistics of Validation Databases
| Database | Primary Focus | Number of NRPS-relevant Entries | Key Data Types for Validation |
|---|---|---|---|
| MIBiG (v3.1) | Characterized BGCs | ~2,000 BGCs (∼40% include NRPS) | BGC sequences, substrate specificity, chemical structures, literature links |
| NORINE (2024) | Nonribosomal Peptides | ~1,400 Unique Peptides | Peptide structure (SMILES, InChI), monomer list, biological activity |
| StrepDB | Streptomyces Genomics | ~3,300 Genomes | Annotated NRPS genes, genome context, phylogeny, PKS/NRPS domain predictions |
Table 2: Data Utility for NRPS Module Prediction Validation
| Validation Step | MIBiG | NORINE | StrepDB |
|---|---|---|---|
| A-domain Substrate Prediction | High (Experimental linkage) | Medium (Monomer list) | Medium (In silico domain calls) |
| Module Order & Architecture | High (BGC-to-product map) | High (Peptide sequence) | Medium (Gene cluster organization) |
| Cross-genus Conservation | Low (Focused on characterized BGCs) | Low (Structure-focused) | High (Comparative genomics) |
| Training Data for ML Models | High (Curated positive set) | High (Chemical structures) | Medium (Genomic sequences) |
Experimental Protocols for Database-Supported Validation
Protocol 2.1: ValidatingIn SilicoA-domain Predictions Using MIBiG
Purpose: To benchmark the accuracy of computational tools (e.g., NRPSpredictor2, SANDPUMA) that predict A-domain substrate specificity. Materials: Predicted A-domain sequences from a target BGC; MIBiG API or flat files; sequence alignment software (e.g., ClustalOmega). Procedure:
- Query Construction: Extract the 8-10 amino acid residue "signature sequence" (core motifs A8 & A10) from your A-domain of interest.
- MIBiG Reference Extraction: Via the MIBiG REST API (
https://mibig.secondarymetabolites.org/api), retrieve all entries with"biosyn_class": "NRPS". Parse the associated GenBank files to extract experimentally validated A-domain signature sequences and their assigned substrates. - Alignment & Comparison: Perform multiple sequence alignment of your query sequence against the curated MIBiG reference set. Identify the closest homolog(s) with experimental validation.
- Validation: Assign the substrate of the closest validated homolog to your query. Compare this assignment to the prediction from your primary computational tool. A match constitutes validation.
Protocol 2.2: Correlating Predicted Module Assembly to Chemical Structure via NORINE
Purpose: To verify that a predicted linear order of NRPS modules matches the monomer sequence of the final peptide.
Materials: Predicted module order (list of A-domain substrates); NORINE database download (http://norine.univ-lille.fr/download).
Procedure:
- Hypothesis Generation: From your genomic analysis, generate a predicted peptide sequence (e.g.,
D-Phe - L-Leu - D-Val - L-Pro). - NORINE Query: Convert your predicted monomer sequence into a simplified string (e.g.,
Phe-Leu-Val-Pro). Search the NORINEpeptide.tsvfile for entries containing this exact monomer sequence or sub-sequences. - Stereochemistry Check: For matches found, examine the detailed entry to confirm the stereochemistry (
DorL) of each monomer matches your prediction. - Validation Outcome: A full match validates the module order prediction. A partial match may indicate a misprediction of epimerization or module skipping.
Protocol 2.3: Comparative Genomic Analysis of NRPS Modules Using StrepDB
Purpose: To assess the conservation of a predicted NRPS module architecture across related producer strains.
Materials: Target NRPS gene sequence; StrepDB BLAST server (https://strepdb.streptomyces.org.uk/blast.php).
Procedure:
- Sequence Submission: Use the protein sequence of your NRPS of interest as a query in the StrepDB "Protein BLAST" search against the "All annotated proteins" database.
- Hit Analysis: Filter results for high-identity hits (e.g., >80%). Examine the genomic context of top hits via provided links. Confirm the presence of a syntenic BGC.
- Domain Architecture Comparison: Use the integrated "PKS/NRPS Analysis" tools on hit entries to compare the domain organization (A-T-C-E[optional] modules) with your query.
- Validation: High conservation of module sequence and architecture across multiple strains strengthens the confidence in your original prediction.
Visualizations
Validation Workflow for NRPS Prediction
Data Structure of Core Validation Resources
Table 3: Key Research Reagent Solutions for Database-Driven Validation
| Item Name / Resource | Function / Purpose | Key Provider / Source |
|---|---|---|
| antiFLAG M2 Affinity Gel | Immunoprecipitation of FLAG-tagged NRPS proteins for in vitro biochemical assays (e.g., ATP-PPᵢ exchange). | Sigma-Aldrich |
| Streptavidin Magnetic Beads | Pulldown of biotinylated carrier protein (CP) domains to study inter-domain interactions and substrate channeling. | Thermo Fisher Scientific |
| [¹⁴C]-labeled Amino Acids | Radiolabeled substrates for direct measurement of A-domain adenylation and thioesterification activity. | American Radiolabeled Chemicals |
| Phusion High-Fidelity DNA Polymerase | PCR amplification of NRPS genes or domains from genomic DNA for cloning and heterologous expression. | New England Biolabs |
| Ni-NTA Superflow Resin | Purification of His-tagged recombinant NRPS protein fragments expressed in E. coli. | Qiagen |
| MIBiG REST API Client (Python) | Programmatic access to latest MIBiG data for automated validation pipelines. | requests library; MIBiG.org |
| NORINE SDF Structure File | Library of nonribosomal peptide structures for cheminformatics analysis and substructure searching. | NORINE website |
| StrepDB BLAST Suite | Web-based tools for comparative genomics and conserved domain analysis within Streptomyces. | StrepDB website |
| anti-Pan-ACP Antibody | Detection of acyl carrier proteins (CP domains) across various NRPS systems in Western blotting. | Custom generation / research collaborator |
Within the broader thesis on nonribosomal peptide synthetase (NRPS) module prediction from chemical structure, retrospective validation serves as a critical proof-of-concept. By applying predictive algorithms and bioinformatic tools to well-characterized pathways like those for vancomycin and daptomycin, we benchmark accuracy, identify limitations, and refine methodologies for novel natural product discovery. This application note details the protocols and results for such validation studies.
Retrospective Prediction Workflow Protocol
Protocol: Target Compound Selection and Data Curation
Objective: Assemble a gold-standard dataset of known NRPS-derived compounds with fully elucidated biosynthetic gene clusters (BGCs). Materials:
- Source Databases: MIBiG (Minimum Information about a Biosynthetic Gene cluster), PubChem, AntiSMASH results repository.
- Software: NCBI BLAST suite, Clustal Omega for sequence alignment.
- In-house Curation Scripts: Python scripts for data parsing and formatting.
Procedure:
- Select target compounds (e.g., Vancomycin, Daptomycin) based on clinical relevance and well-documented BGCs (e.g., MIBiG Accession: BGC0001183 for vancomycin).
- Retrieve the corresponding amino acid sequences of all NRPS adenylation (A) domains from the MIBiG database entry.
- Extract the 8-10 amino acid residue "signature sequences" (Stachelhaus codes) for each A-domain.
- Manually curate the known substrate specificity for each module from primary literature.
- Store data in a structured format (e.g., CSV) for analysis.
Protocol:In SilicoSubstrate Specificity Prediction
Objective: Predict the amino acid substrate for each A-domain module using established prediction tools. Materials:
- Prediction Servers: NRPSpredictor2, prediCAT, Stachelhaus code predictor.
- Computational Environment: Local installation of NRPSpredictor2 or web server API.
- Input Data: Curated signature sequences from Protocol 2.1.
Procedure:
- For each A-domain signature sequence, submit to NRPSpredictor2 (web or local).
- Select the "SVM prediction" method for detailed specificity.
- Record the top predicted substrate and prediction score.
- Run parallel predictions using the Stachelhaus code-based method for comparison.
- Aggregate all predictions into a results table.
Protocol: Whole Gene Cluster Analysis and Module Boundary Definition
Objective: Confirm the colinearity rule and define module boundaries within the target BGC. Materials:
- Software: antiSMASH 7.0, PRISM 4.
- Genomic Data: FASTA file of the entire BGC region for the target compound.
Procedure:
- Submit the genomic region containing the BGC to the antiSMASH web server (https://antismash.secondarymetabolites.org/).
- Select appropriate detection strictness (Relaxed for known clusters).
- Analyze the output graphical map to identify NRPS modules, their domain organization (C-A-T, etc.), and module order.
- Compare the antiSMASH-predicted module organization against the literature-derived architecture.
- Use this map to assign each predicted A-domain specificity (from 2.2) to a specific module in the assembly line.
Results and Data Presentation
Table 1: Retrospective Prediction Accuracy for Vancomycin (Cyclochlorogeusin NRPS)
| Module (Domain) | Known Substrate | NRPSpredictor2 Prediction | Prediction Score (SVM) | Correct? | Method (Stachelhaus) Prediction |
|---|---|---|---|---|---|
| Module 1 (A1) | L-Leucine | L-Leucine | 0.92 | Yes | L-Leucine |
| Module 2 (A2) | L-4-Hydroxyphenylglycine | L-4-Hydroxyphenylglycine | 0.88 | Yes | L-Tyrosine* |
| Module 3 (A3) | L-4-Hydroxyphenylglycine | L-4-Hydroxyphenylglycine | 0.91 | Yes | L-Tyrosine* |
| Module 4 (A4) | D-4-Hydroxyphenylglycine | L-Tyrosine* | 0.45 | No | L-Tyrosine* |
| Module 5 (A5) | L-Tryptophan | L-Tryptophan | 0.96 | Yes | L-Tryptophan |
| Module 6 (A6) | L-Asparagine | L-Asparagine | 0.89 | Yes | L-Asparagine |
| Module 7 (A7) | L-4-Hydroxyphenylglycine | L-4-Hydroxyphenylglycine | 0.87 | Yes | L-Tyrosine* |
| Overall Accuracy | 85.7% (6/7) | 57.1% (4/7) |
Note: Stachelhaus code method often fails to distinguish between L-Tyrosine and its non-proteinogenic derivative L-4-Hydroxyphenylglycine.
Table 2: Retrospective Prediction Accuracy for Daptomycin (A21978C NRPS)
| Module (Domain) | Known Substrate | NRPSpredictor2 Prediction | Prediction Score (SVM) | Correct? |
|---|---|---|---|---|
| dptA Module 1 (A1) | L-Tryptophan | L-Tryptophan | 0.94 | Yes |
| dptA Module 2 (A2) | L-Asparagine | L-Asparagine | 0.90 | Yes |
| dptA Module 3 (A3) | L-2,4-diaminobutyric acid | L-Glutamine* | 0.51 | No |
| dptBC Module 1 (A4) | L-Kynurenine | L-Tryptophan* | 0.62 | No |
| dptBC Module 2 (A5) | L-Threonine | L-Threonine | 0.93 | Yes |
| dptBC Module 3 (A6) | Glycine | Glycine | 0.99 | Yes |
| dptBC Module 4 (A7) | D-Alanine | D-Alanine | 0.95 | Yes |
| dptBC Module 5 (A8) | L-Asparagine | L-Asparagine | 0.89 | Yes |
| dptBC Module 6 (A9) | L-Serine | L-Serine | 0.91 | Yes |
| dptBC Module 7 (A10) | L-Threonine | L-Threonine | 0.94 | Yes |
| dptBC Module 8 (A11) | Glycine | Glycine | 0.98 | Yes |
| dptBC Module 9 (A12) | L-Serine | L-Serine | 0.92 | Yes |
| dptBC Module 10 (A13) | L-2,4-diaminobutyric acid | L-Glutamine* | 0.49 | No |
| Overall Accuracy | 84.6% (11/13) |
Note: Failures often involve non-proteinogenic amino acids (e.g., L-2,4-diaminobutyric acid, L-Kynurenine) not well-represented in training sets.
Visualization of Workflow and Results
Title: Retrospective NRPS Prediction Workflow
Title: Vancomycin Module Prediction vs. Known Specificity
The Scientist's Toolkit: Research Reagent Solutions
Table 3: Essential Materials for NRPS Retrospective Validation Studies
| Item | Function/Benefit | Example/Supplier |
|---|---|---|
| MIBiG Database | Curated repository of experimentally characterized BGCs for gold-standard data. | https://mibig.secondarymetabolites.org/ |
| antiSMASH Suite | Primary tool for identifying, annotating, and visualizing BGCs in genomic data. | https://antismash.secondarymetabolites.org/ |
| NRPSpredictor2 | Machine-learning based tool (SVM) for predicting A-domain substrate specificity from sequence. | Local install or Web service |
| PRISM 4 | Predicts chemical structures from genomic data, useful for cross-validating predictions. | http://prism.adapsyn.com/ |
| Clustal Omega | Multiple sequence alignment tool for comparing A-domain sequences and identifying signature motifs. | EBI Web Services |
| Python/Biopython | Scripting environment for automating data retrieval, parsing, and analysis from various databases. | Anaconda Distribution |
| Jupyter Notebook | Interactive environment for documenting the analysis workflow, ensuring reproducibility. | Project Jupyter |
| Custom HMM Profiles | Hidden Markov Model profiles for specific non-proteinogenic amino acid A-domains (e.g., for D-Hpg). | Constructed via HMMER from aligned known sequences |
Within the broader thesis on Nonribosomal Peptide Synthetase (NRPS) module prediction from chemical structure, selecting the appropriate computational and experimental tool suite is critical. This application note provides a comparative analysis of key platforms and detailed protocols for researchers aiming to link natural product chemistry to biosynthetic machinery.
Comparative Analysis of Primary Bioinformatics Platforms
The following table summarizes the core quantitative features and optimal use cases for major platforms in NRPS research.
Table 1: Comparison of Key Bioinformatics Suites for NRPS Module Prediction
| Platform/Suite Name | Primary Function | Input Data Type | Key Algorithm/Model | Prediction Accuracy (Reported) | Best Used For | License/Cost |
|---|---|---|---|---|---|---|
| antiSMASH | BGC identification & module prediction | Genomic DNA sequence | Hidden Markov Models (HMMs), ClusterFinder | >90% (BGC detection) | Initial genomic mining & macro-level module delineation | Open Source |
| PRISM 4 | Chemical structure prediction from sequence | DNA or Protein sequence | Rule-based, Chemical Logic | ~80% (substrate specificity) | Predicting final product chem. from gene cluster | Open Source |
| NRPSpredictor2 | Adenylation (A) domain specificity | Protein sequence (A domain) | Support Vector Machines (SVMs) | >85% (for 8 major substrates) | High-resolution A-domain substrate prediction | Open Source |
| NPRSsp | Condensation (C) domain specificity | Protein sequence (C domain) | HMMs & Phylogenetics | N/A (qualitative) | Determining C domain type (LCL, DCL, starter, etc.) | Open Source |
| SynBIP | Module interaction & assembly line logic | Protein sequences (full modules) | Docking & Interface Prediction | N/A | Modeling inter-module interactions & chain transfer | Open Source |
| MIBiG | Repository of known BGCs | Chemical structure, BioActivity, Sequence | Curation & Standardization | Reference Data | Benchmarking predictions against experimentally validated BGCs | Open Access |
Detailed Protocols
Protocol 1: In Silico NRPS Module Analysis Workflow Using antiSMASH and NRPSpredictor2
Objective: To predict the NRPS assembly line and adenylation domain substrates from a genomic region of interest.
Materials (Research Reagent Solutions):
- Genomic FASTA File: Contains the DNA sequence of the bacterial/fungal strain.
- antiSMASH Database Files (e.g., Pfam, ClusterBlast): Required for domain detection and homology analysis.
- NRPSpredictor2 SVM Models: Pre-trained models for classifying A-domain sequences into substrate specificity.
- Linux/Unix-based Compute Environment: Most tools are command-line optimized.
Procedure:
- Data Preparation: Isolate the genomic region believed to contain the NRPS gene cluster. Save in FASTA format (
cluster.fasta). - Run antiSMASH Analysis:
- Interpret antiSMASH Results: Open the generated
.jsonfile or web page. Identify the NRPS-related domains (A, PCP, C, TE, etc.) and note their order and module organization. - Extract A-domain Sequences: Manually extract the amino acid sequence of each A-domain from the antiSMASH GenBank output file.
- Run NRPSpredictor2:
- Submit each individual A-domain sequence via the NRPSpredictor2 web server or use the standalone tool.
- For bulk analysis, format sequences in FASTA and use the command line:
- Integrate Predictions: Combine the module architecture from antiSMASH with the substrate predictions for each A-domain to propose a linear order of monomers.
Protocol 2: Validating Predictions via LC-MS/MS Metabolite Profiling
Objective: To correlate in silico NRPS module predictions with the actual secondary metabolite produced by the organism.
Materials (Research Reagent Solutions):
- Culture Medium (e.g., ISP2, R2A): For growth of the NRPS-producing microorganism.
- Extraction Solvent (Ethyl Acetate:MeOH, 4:1 v/v): For metabolite extraction from cell pellet and supernatant.
- LC-MS Grade Acetonitrile and Water (with 0.1% Formic Acid): For high-resolution liquid chromatography.
- Analytical Standard (if available): Purified compound matching the predicted chemical structure for comparison.
Procedure:
- Culture and Metabolite Extraction: Grow the source organism in appropriate media for 5-7 days. Centrifuge to separate biomass and supernatant. Extract metabolites from both fractions with extraction solvent. Dry under vacuum.
- Sample Reconstitution: Reconstitute dried extract in pure MS-grade methanol for analysis.
- LC-MS/MS Method:
- Column: C18 reversed-phase (e.g., 2.1 x 100 mm, 1.7 µm).
- Gradient: 5% to 95% acetonitrile in water (both with 0.1% formic acid) over 18 minutes.
- Mass Spectrometer: High-resolution Q-TOF or Orbitrap in positive/negative electrospray ionization mode.
- Data-Dependent Acquisition (DDA): Top 5 most intense ions per scan cycle selected for MS/MS fragmentation.
- Data Analysis:
- Use software (e.g., MZmine, GNPS) to process raw data, detect molecular features, and identify adducts.
- Calculate the exact mass of the predicted natural product. Search for its [M+H]+ or [M-H]- ion in the extracted ion chromatogram.
- Compare the MS/MS fragmentation pattern of the detected ion with in-silico fragmentation tools (e.g., CFM-ID, GNPS) or literature data.
Logical Workflow and Pathway Visualizations
Diagram Title: NRPS Prediction & Validation Workflow
Diagram Title: Simplified NRPS Biosynthetic Assembly Line
Conclusion
Predicting NRPS modules from chemical structure represents a powerful convergence of bioinformatics, cheminformatics, and machine learning, fundamentally shifting natural product discovery from serendipity to rational design. While foundational principles establish a clear link between chemistry and biosynthetic logic, methodological advances in deep learning and integrated platforms have dramatically increased predictive power. Successful application requires careful navigation of troubleshooting challenges, particularly for novel scaffolds. Validation studies confirm that while no single tool is infallible, a consensus approach using complementary platforms yields robust hypotheses for experimental testing. The future lies in larger, curated training datasets, the integration of AlphaFold2-predicted A-domain structures, and real-time prediction within metabolomics workflows. This capability will be crucial for reviving microbial drug discovery, enabling the rapid prioritization of cryptic gene clusters and the bioengineering of novel therapeutic peptides with tailored properties.