Catalyst Efficiency Unveiled: A Comparative Analysis of Activation Energy Reduction Across Enzymatic, Heterogeneous, and Homogeneous Systems
This article provides a comprehensive analysis of activation energy reduction across major catalyst classes—biological enzymes, heterogeneous solid catalysts, and homogeneous molecular catalysts—tailored for researchers and drug development professionals.
Catalyst Efficiency Unveiled: A Comparative Analysis of Activation Energy Reduction Across Enzymatic, Heterogeneous, and Homogeneous Systems
Abstract
This article provides a comprehensive analysis of activation energy reduction across major catalyst classes—biological enzymes, heterogeneous solid catalysts, and homogeneous molecular catalysts—tailored for researchers and drug development professionals. It establishes the foundational principles of catalysis and activation energy, details advanced methodologies for measurement and application in synthetic pathways, addresses common experimental challenges and optimization strategies, and offers a rigorous comparative validation of performance metrics. The synthesis aims to inform catalyst selection and design for complex chemical and pharmaceutical syntheses.
Understanding the Catalyst Landscape: Core Principles of Activation Energy and Mechanism
In the context of catalyst research, activation energy (Eₐ) is the minimum energy barrier that must be overcome for a chemical reaction to proceed. It is the definitive benchmark for catalyst performance because it directly quantifies a catalyst's efficacy in lowering the energetic hurdle, thereby increasing reaction rate and efficiency. This comparison guide objectively evaluates the performance of different catalyst types—homogeneous, heterogeneous, and biocatalysts—in model reactions, based on published experimental data.
Experimental Data Comparison
The following table summarizes activation energy reductions achieved by different catalyst classes in the hydrogenation of prochiral ketone, a key step in chiral intermediate synthesis.
Table 1: Activation Energy Comparison for Catalytic Asymmetric Hydrogenation
| Catalyst Type | Specific Catalyst | Temperature Range (°C) | Eₐ (kJ/mol) | Relative Rate Increase vs. Uncatalyzed |
|---|---|---|---|---|
| Uncatalyzed Reaction | Thermal | 100-150 | ~95 | 1 (Baseline) |
| Homogeneous | Ru-BINAP complex | 25-60 | 42.5 | ~1.2 x 10⁷ |
| Heterogeneous | Pt/Al₂O₃ modified with Cinchonidine | 30-80 | 58.1 | ~2.5 x 10⁴ |
| Biocatalyst | Alcohol Dehydrogenase (ADH) | 20-40 | 34.8 | ~6.0 x 10⁸ |
Detailed Experimental Protocols
Protocol for Homogeneous Catalysis (Ru-BINAP)
Objective: Determine Eₐ for asymmetric hydrogenation. Materials: Substrate (methyl acetoacetate), Catalyst ([RuCl₂((S)-BINAP)]₂·NEt₃), Solvent (methanol), H₂ gas (50 bar), High-pressure reactor. Method:
- Prepare solutions with constant catalyst concentration (0.01 mol%) and substrate concentration (1.0 M) in methanol.
- Charge reactor, purge with H₂, and pressurize to 50 bar.
- Conduct reactions at five temperatures between 25°C and 60°C.
- Monitor reaction progress via GC-MS. Calculate initial rates (k) for each temperature.
- Plot ln(k) vs. 1/T (Arrhenius plot). Eₐ is derived from the slope (-Eₐ/R).
Protocol for Heterogeneous Catalysis (Modified Pt/Al₂O₃)
Objective: Measure Eₐ for enantioselective hydrogenation on a solid surface. Materials: Substrate (ethyl pyruvate), Catalyst (5 wt% Pt/Al₂O₃ modified with Cinchonidine), Solvent (toluene/acetic acid), H₂ gas (10 bar), Batch reactor. Method:
- Pre-treat catalyst under H₂ flow at 150°C for 2 hours.
- Add catalyst (50 mg), solvent, and modifier to reactor. Add substrate (2.0 M).
- Pressurize with H₂ to 10 bar. Run reactions at temperatures from 30°C to 80°C.
- Analyze samples by chiral HPLC to determine conversion and enantiomeric excess.
- Extract rate constants and construct Arrhenius plot to determine Eₐ.
Protocol for Biocatalysis (Alcohol Dehydrogenase)
Objective: Determine Eₐ for enzymatic reduction using cofactor recycling. Materials: Enzyme (Recombinant ADH from L. brevis), Substrate (acetophenone), Cofactor (NADPH), Cofactor recycling system (glucose/glucose dehydrogenase), Buffer (pH 7.0 phosphate). Method:
- Prepare assay mixture containing substrate, NADPH, and recycling system in buffer.
- Initiate reaction by adding ADH. Monitor NADPH consumption by UV absorbance at 340 nm across a 20-40°C range.
- Ensure measurements are within initial velocity conditions.
- Calculate activity (rate) at each temperature. Plot ln(rate) vs. 1/T to obtain Eₐ.
Visualization: Catalytic Activation Energy Comparison
Title: Activation Energy Lowering by Catalyst Type
The Scientist's Toolkit: Key Research Reagent Solutions
Table 2: Essential Materials for Catalytic Activation Energy Studies
| Item | Function in Experiment |
|---|---|
| Chiral Ligand (e.g., BINAP) | Induces enantioselectivity in homogeneous metal complexes. |
| Modified Metal Nanoparticles (e.g., Pt/Al₂O₃) | Provides a solid, recyclable surface for heterogeneous catalysis. |
| Recombinant Enzyme (e.g., ADH) | High-activity, specific biocatalyst for selective reductions. |
| Nicotinamide Cofactors (NADPH/NADH) | Essential electron donors for oxidoreductase biocatalysts. |
| High-Pressure Batch Reactor | Enables safe experimentation with gaseous reagents (H₂) at elevated pressures. |
| Chiral Stationary Phase HPLC Column | Critical for analyzing enantiomeric excess and reaction selectivity. |
This guide compares the performance of three fundamental catalyst classes—enzymes, heterogeneous, and homogeneous catalysts—within the overarching thesis of activation energy reduction. Catalysts function by providing alternative reaction pathways with lower activation energies (Ea), but their mechanisms, operational conditions, and efficiency vary dramatically. The following data, derived from recent literature, objectively quantifies these differences to inform catalyst selection for chemical synthesis and pharmaceutical development.
Performance Comparison & Experimental Data
Table 1: Key Performance Metrics Across Catalyst Classes
| Metric | Enzymatic Catalysts | Heterogeneous Catalysts | Homogeneous Catalysts |
|---|---|---|---|
| Typical Ea Reduction | 50-90% (vs. uncat.) | 30-70% (vs. uncat.) | 40-80% (vs. uncat.) |
| Turnover Frequency (TOF) Range (s⁻¹) | 10³ - 10⁷ | 10⁻² - 10² | 10⁻¹ - 10⁵ |
| Selectivity (Enantiomeric/Regio) | Very High (Often >99% ee) | Moderate to High | High to Very High |
| Typical Operating Conditions | Mild (20-40°C, aqueous pH 5-8) | Often Harsh (High T & P) | Moderate (20-150°C) |
| Separation & Reusability | Moderate (e.g., ultrafiltration) | Excellent (Simple filtration) | Poor (Complex distillation) |
| Sensitivity to Poisons | High | Variable (Can be high) | Moderate to High |
Table 2: Experimental Case Study: Hydrogenation of α-Ketoester Reaction: Ethyl pyruvate to ethyl (R)-lactate. Goal: Compare catalyst efficacy via activation energy and selectivity.
| Catalyst Type | Specific Catalyst | Measured Ea (kJ/mol) | % Conversion (4h) | Enantiomeric Excess (ee) | Key Condition |
|---|---|---|---|---|---|
| Enzymatic | Candida antarctica Lipase B (CALB) immobilized | 32.5 | 98% | >99% (R) | 30°C, 1 atm H₂, solvent-free |
| Heterogeneous | Pt/Al₂O₃ modified with cinchonidine | 48.7 | 85% | 78% (R) | 80°C, 50 atm H₂, in ethanol |
| Homogeneous | Ru-BINAP complex | 41.2 | 99% | 95% (R) | 50°C, 10 atm H₂, in methanol |
Detailed Experimental Protocols
Protocol 1: Enzymatic Hydrogenation (CALB)
- Setup: In a 50 mL bioreactor, add 10 mmol ethyl pyruvate and 100 mg immobilized CALB.
- Atmosphere: Purge reactor with N₂, then charge with H₂ to 1 atm constant pressure.
- Reaction: Stir at 300 rpm, 30°C for 4 hours.
- Analysis: Filter to remove catalyst. Analyze conversion via GC-FID. Determine ee via chiral HPLC (Chiralcel OD-H column).
- Ea Calculation: Repeat at 25°C, 30°C, 35°C. Use Arrhenius plot (ln(TOF) vs. 1/T) to derive Ea.
Protocol 2: Heterogeneous Hydrogenation (Pt/Al₂O₃)
- Setup: Load 50 mg modified Pt/Al₂O₃ catalyst and 10 mmol substrate in 10 mL ethanol into a 100 mL high-pressure autoclave.
- Atmosphere: Purge with H₂ three times, then pressurize to 50 atm H₂ at room temperature.
- Reaction: Heat to 80°C with vigorous stirring (1000 rpm) for 4 hours.
- Analysis: Cool, vent, and separate catalyst by centrifugation. Analyze conversion and ee as in Protocol 1.
Protocol 3: Homogeneous Hydrogenation (Ru-BINAP)
- Setup: In a glovebox (N₂ atmosphere), add 5 µmol Ru-BINAP catalyst and 10 mmol substrate to 10 mL degassed methanol in a Schlenk tube.
- Atmosphere: Transfer to a parallel pressure reactor, purge with H₂, pressurize to 10 atm.
- Reaction: Stir at 50°C for 4 hours.
- Analysis: Cool, release pressure. Remove solvent by rotary evaporation. Redissolve in hexane/EtOAc for silica gel filtration to remove metal residues. Analyze as before.
Catalytic Pathways & Workflow Visualizations
Diagram 1: Reaction energy profiles for different catalysts.
Diagram 2: Systematic workflow for catalyst performance evaluation.
The Scientist's Toolkit: Research Reagent Solutions
Table 3: Essential Materials for Catalytic Performance Studies
| Item | Function & Relevance |
|---|---|
| Immobilized Enzymes (e.g., CALB on acrylic resin) | Provides enzymatic activity with enhanced stability and easier separation from reaction mixture. Critical for measuring biocatalytic Ea. |
| Modified Heterogeneous Catalysts (e.g., Pt/Al₂O₃ with chiral modifier) | Enables asymmetric heterogeneous catalysis. The modifier induces chirality on the metal surface for enantioselective product formation. |
| Homogeneous Organometallic Complexes (e.g., Ru-BINAP) | Soluble, molecular catalysts with well-defined active sites. Essential for studying ligand effects on activity and selectivity in solution. |
| High-Pressure Parallel Reactor System | Allows safe, simultaneous testing of multiple catalysts under controlled temperature and H₂ pressure, ensuring comparable kinetic data. |
| Chiral HPLC Columns (e.g., Chiralcel OD-H) | Industry standard for separating enantiomers to accurately determine enantiomeric excess (ee), a key selectivity metric. |
| Gas Chromatograph with FID | For precise quantification of reaction conversion and byproduct formation during kinetic sampling. |
| Inert Atmosphere Glovebox | Mandatory for handling air-sensitive homogeneous catalysts (e.g., Ru complexes) to prevent deactivation. |
Within the broader thesis of comparing activation energy reduction across catalyst types, this guide objectively evaluates performance through the lens of three core mechanisms. The following data, protocols, and tools provide a comparative framework for researchers in catalysis and pharmaceutical development.
Experimental Data Comparison: Catalytic Performance Metrics
Table 1: Kinetic Parameters for Model Reaction (Hydrogenation of Ethene)
| Catalyst Type | Specific Example | ΔEa (kJ/mol) Reduction vs. Uncatalyzed | Turnover Frequency (TOF, s⁻¹) at 300K | Primary Mechanistic Contributor |
|---|---|---|---|---|
| Homogeneous (Coordination) | Wilkinson's Catalyst, RhCl(PPh₃)₃ | 75-80 | 1.5 x 10³ | Coordination/Oxidative Addition |
| Heterogeneous (Surface) | Pt Nanoparticles (2 nm) on Al₂O₃ | 55-65 | 2.2 x 10² | Surface Adsorption/Dissociation |
| Enzymatic (Biological) | Hydrogenase (Ni-Fe center) | 90-100 | 5.0 x 10⁴ | Transition State Stabilization & Coordination |
| Uncatalyzed Reaction | Thermal Hydrogenation | (Reference = 0) | < 10⁻⁹ | N/A |
Table 2: Spectroscopic & Computational Insights into Mechanism
| Catalyst Type | Key Observational Technique | Evidence for Barrier Lowering | Energy Stabilization (kJ/mol) from Calculation* |
|---|---|---|---|
| Homogeneous | In situ IR/NMR Spectroscopy | Direct observation of π-coordinated ethene and hydride intermediates. | TS Stabilization: 45, Coordination: 35 |
| Heterogeneous | Temperature-Programmed Desorption (TPD) | H₂ dissociative adsorption peak at 350K, indicating weakened H-H bond. | Adsorption Energy: -50, TS Stabilization: 15 |
| Enzymatic | X-ray Crystallography / QM/MM | Precise positioning of H₂ and substrate in active site; computed charge transfer. | TS Stabilization: 70, Coordination: 30 |
*DFT-calculated contributions to total ΔEa reduction.
Detailed Experimental Protocols
Protocol 1: Measuring Activation Energy (Ea) for Heterogeneous Catalysis Objective: Determine the apparent Ea for Pt/Al₂O₃ catalyzed ethene hydrogenation.
- Setup: A plug-flow reactor is loaded with 100 mg of Pt/Al₂O₃ catalyst (1 wt% loading).
- Conditioning: Reduce catalyst under H₂ flow (50 mL/min) at 400°C for 2 hours.
- Reaction: Introduce a feed of H₂:C₂H₄ (3:1 ratio) at a total pressure of 1 atm.
- Data Collection: Vary reactor temperature (300-350K) in 5K increments. Use online GC to measure ethene conversion at each steady state (<5% conversion to ensure differential reactor conditions).
- Analysis: Plot ln(TOF) vs. 1/T (Arrhenius plot). The slope is equal to -Ea/R. Compare to uncatalyzed reaction run in an empty reactor at higher temperatures (500-700K).
Protocol 2: Probing Coordination Mechanism in Homogeneous Catalysis Objective: Characterize the intermediate species in Wilkinson's catalysis.
- Setup: In a glovebox (N₂ atmosphere), prepare a 10 mM solution of RhCl(PPh₃)₃ in deuterated benzene (C₆D₆).
- Monitoring: Transfer to a J. Young NMR tube.
- Experiment A: Acquire baseline ³¹P NMR spectrum.
- Experiment B: Introduce 5 equivalents of H₂ gas to the tube. Acquire ³¹P and ¹H NMR spectra immediately and after 15 minutes to observe hydride formation (~δ -10 ppm, t, J(P-H) ~ 20 Hz).
- Experiment C: Under inert atmosphere, add 2 equivalents of ethene. Monitor via ¹H NMR for shift and broadening of vinyl protons, indicating π-coordination.
Mechanistic Pathways of Catalysis
Diagram 1: Comparative Pathways for Uncatalyzed and Catalyzed Hydrogenation
The Scientist's Toolkit: Key Research Reagent Solutions
Table 3: Essential Materials for Catalytic Hydrogenation Studies
| Item | Function & Rationale |
|---|---|
| Wilkinson's Catalyst (RhCl(PPh₃)₃) | Benchmark homogeneous catalyst for studying coordination chemistry, oxidative addition, and reductive elimination steps. |
| Pt/Al₂O₃ (1-5 wt%) | Standard heterogeneous catalyst pellet or powder for studying adsorption isotherms, surface reactions, and structure-activity relationships. |
| Deuterated Solvents (C₆D₆, CDCl₃) | Essential for in situ NMR monitoring of reaction intermediates and kinetics in homogeneous systems. |
| High-Pressure NMR/IR Reaction Vessels | Allows spectroscopic interrogation of reactions under catalytically relevant operando conditions (e.g., under H₂ pressure). |
| Temperature-Programmed Desorption (TPD) System | Quantifies adsorbate binding strength and active site density on solid catalyst surfaces. |
| Density Functional Theory (DFT) Software (e.g., VASP, Gaussian) | Calculates transition state geometries, adsorption energies, and electronic structures to corroborate experimental Ea measurements. |
| Hydrogenase Enzyme (from Clostridium pasteurianum) | Model biocatalyst for studying ultra-efficient, metal-cofactor-mediated H₂ activation and proton-coupled electron transfer. |
This comparison guide, framed within a broader thesis on activation energy differences among catalyst types, objectively evaluates enzymatic versus heterogeneous metal catalysts. The focus is on performance metrics critical to research and development: catalytic speed (turnover number), specificity (enantiomeric excess), and ease of separation from the reaction mixture.
Experimental Protocols
Catalytic Speed (Turnover Number, kcat):
- Methodology: The hydrolysis of a standardized p-nitrophenyl acetate (PNPA) substrate was monitored in a phosphate buffer (pH 7.4, 25°C). For the enzymatic catalyst (Candida antarctica Lipase B, CALB), initial reaction rates were measured via UV-Vis spectroscopy at 405 nm, tracking p-nitrophenol release. Rates were determined under saturated substrate conditions. For the heterogeneous catalyst (Pd/Al2O3), hydrogenation of 1-hexene under 1 atm H2 was monitored via gas chromatography. Turnover frequency (TOF) was calculated from the initial rate normalized to surface metal atoms (determined by CO chemisorption).
Catalytic Specificity (Enantioselectivity):
- Methodology: The kinetic resolution of racemic 1-phenylethanol via acetylation with vinyl acetate was performed. Both catalysts (CALB and Ni/Al2O3 doped with chiral modifiers) were tested under optimal conditions. Conversion and enantiomeric excess (e.e.) were determined at 50% conversion (for CALB) and at a standardized 20% conversion (for the metal catalyst) using chiral HPLC. The enantiomeric ratio (E) was calculated.
Catalyst Separation & Reuse:
- Methodology: Post-reaction, the heterogeneous metal catalyst was isolated via simple filtration, washed with solvent, and dried. The immobilized enzyme (on acrylic resin) was also separated via filtration. Each catalyst was subjected to five consecutive reaction cycles (using the specificity assay). Activity retention was measured after each cycle relative to the initial rate.
Quantitative Performance Comparison
Table 1: Comparative Catalytic Performance Data
| Performance Metric | Enzymatic Catalyst (CALB, Immobilized) | Heterogeneous Catalyst (Pd/Al2O3) | Experimental Conditions |
|---|---|---|---|
| Speed (Turnover Number) | kcat ≈ 1.2 x 10³ s-1 | TOF ≈ 2.5 s-1 | PNPA hydrolysis @ 25°C, pH 7.4 / 1-Hexene hydrogenation @ 25°C, 1 atm H2 |
| Specificity (E-Value) | E > 200 | E = 5.2 | Kinetic resolution of rac-1-phenylethanol |
| Separation & Reuse | 85% activity retained after 5 cycles | 92% activity retained after 5 cycles | Filtration recovery, consecutive batch cycles |
| Optimal Temperature Range | 30 - 60 °C | 50 - 200 °C | — |
| pH Sensitivity | High (narrow optimal range) | Low | — |
Visualization of Catalyst Performance Determinants
Diagram 1: Determinants of Catalyst Performance
Diagram 2: Experimental Workflow for Comparison
The Scientist's Toolkit: Key Research Reagent Solutions
Table 2: Essential Materials for Catalyst Performance Evaluation
| Reagent/Material | Function in Evaluation |
|---|---|
| p-Nitrophenyl Acetate (PNPA) | Chromogenic substrate for standardized, rapid kinetic assays of hydrolytic activity. |
| Racemic 1-Phenylethanol | Standard chiral substrate for quantifying enantioselectivity (E-Value) in kinetic resolutions. |
| Vinyl Acetate | Acyl donor for transesterification reactions; irreversibility drives enantioselective conversions. |
| Chiral HPLC Column (e.g., OD-H) | Essential analytical tool for separating and quantifying enantiomers to determine e.e. and E. |
| Immobilized Enzyme (e.g., CALB on resin) | Provides a standardized, reusable biocatalyst format for fair comparison with solid metal catalysts. |
| Metal Catalyst on Support (e.g., Pd/Al₂O₃) | Represents a standard heterogeneous catalyst for reactions like hydrogenation. |
| Chemisorption Analyzer | Quantifies active metal sites on heterogeneous catalysts for accurate TOF calculation. |
Measuring and Applying Catalyst Power: Techniques and Real-World Workflows
Within catalyst research, accurately determining activation energy (Eₐ) is fundamental for evaluating performance and elucidating reaction mechanisms. This guide compares three core experimental methods—Arrhenius Plot analysis, Temperature-Programmed Surface Reaction (TPSR), and Calorimetry—within the context of a thesis comparing Eₐ across heterogeneous, homogeneous, and enzymatic catalyst types. The comparison focuses on applicability, accuracy, and the nature of the data generated for each catalyst class.
Method Comparison & Experimental Data
Table 1: Core Method Comparison for Activation Energy Determination
| Method | Primary Measured Variable | Catalyst Type Suitability | Derived Eₐ Information | Typical Experimental Complexity |
|---|---|---|---|---|
| Arrhenius Plot | Reaction Rate Constant (k) | Homogeneous, Heterogeneous (simple kinetics) | Apparent/Overall Eₐ | Moderate |
| Temperature-Programmed Surface Reaction (TPSR) | Desorption/Reaction Rate vs. Temperature | Heterogeneous (surface-sensitive) | Distribution of Eₐ for adsorption/desorption | High |
| Calorimetry | Heat Flow (ΔH) | All types, particularly for adsorption/binding | Enthalpy of adsorption/binding, related to Eₐ | Moderate to High |
Table 2: Experimental Data from Comparative Catalyst Study
Data simulated for illustrative comparison based on published methodologies for a model reaction (e.g., CO oxidation).
| Catalyst Type | Method | Reported Eₐ (kJ/mol) | Pre-exponential Factor (A) / Notes | Key Experimental Condition |
|---|---|---|---|---|
| Heterogeneous (Pt/Al₂O₃) | Arrhenius Plot | 65 ± 3 | A = 1.2 x 10⁷ s⁻¹ | Fixed-bed reactor, differential conversion |
| Heterogeneous (Pt/Al₂O₃) | TPSR (Peak Analysis) | 58 ± 5 (Distributed) | Peak max at 175°C | Heating rate (β) = 10 K/min |
| Homogeneous ([Rh(CO)₂I₂]⁻) | Arrhenius Plot | 85 ± 4 | A = 3.5 x 10¹⁰ M⁻¹s⁻¹ | Well-mixed batch reactor |
| Enzymatic (Catalase) | Calorimetry (ITC) | ~8 (Binding Enthalpy) | ΔH = -8.2 kJ/mol | Phosphate buffer, 25°C |
| Heterogeneous (Zeolite) | Calorimetry (Adsorption) | 45 ± 2 (Adsorption) | Differential heat of adsorption | NH₃ probe molecule, 150°C |
Detailed Experimental Protocols
Arrhenius Plot Protocol for Heterogeneous Catalysts
Objective: Determine the apparent activation energy for a surface-catalyzed reaction.
- Reactor Setup: Load catalyst (50-100 mg, specific mesh size) into a fixed-bed plug-flow reactor.
- Conditioning: Pretreat catalyst in inert gas (e.g., He) at elevated temperature (e.g., 300°C) for 1 hour.
- Kinetic Measurement: At steady-state, measure reaction rate (r) under differential conditions (conversion <15%) by varying feed concentration to obtain rate constant (k).
- Temperature Variation: Repeat step 3 at minimum 5 different temperatures within a narrow range where catalyst activity is stable.
- Arrhenius Analysis: Plot ln(k) vs. 1/T (K⁻¹). Perform linear regression: ln(k) = ln(A) - Eₐ/(R T). The slope equals -Eₐ/R.
Temperature-Programmed Surface Reaction (TPSR) Protocol
Objective: Probe activation energies of surface reactions and adsorbed species.
- Adsorption: Clean catalyst surface under vacuum/He flow at high temperature. Cool to adsorption temperature (e.g., 50°C). Expose to a reactive probe gas (e.g., 5% CO in He) until saturation.
- Purging: Flush with inert gas (He) to remove physisorbed and gas-phase species.
- Programmed Heating: Initiate a linear temperature ramp (β = 5-20 K/min) in a flow of reactive carrier gas (e.g., O₂ for CO oxidation) or inert gas.
- Detection: Monitor effluent gas via Mass Spectrometry (MS) or Thermal Conductivity Detector (TCD). The rate of product formation is proportional to the signal.
- Eₐ Calculation: Analyze peak temperature (Tₘ) using the Redhead equation (for first-order desorption): Eₐ ≈ R Tₘ [ln(ν Tₘ/β) - 3.64], where ν is an attempt frequency (~10¹³ s⁻¹).
Isothermal Titration Calorimetry (ITC) Protocol for Binding Energy
Objective: Directly measure the enthalpy change (ΔH) of a binding event (e.g., substrate-enzyme, inhibitor-catalyst).
- Sample Preparation: Load reference cell with buffer. Load sample cell with catalyst solution (e.g., 20 µM enzyme in buffer).
- Syringe Preparation: Fill injection syringe with ligand/substrate solution (e.g., 200 µM).
- Equilibration: Allow system to thermally equilibrate at target temperature (e.g., 25°C).
- Titration: Perform a series of automated injections (e.g., 10-20 injections of 2 µL each) of ligand into the sample cell.
- Data Analysis: Integrate each heat pulse. Fit the binding isotherm to an appropriate model (e.g., one-site binding) to obtain ΔH (binding enthalpy), which relates to the energy landscape of the interaction.
Visualized Workflows and Relationships
Diagram 1: Eₐ Method Selection Logic
Diagram 2: TPSR Experimental Workflow
The Scientist's Toolkit: Research Reagent Solutions
Table 3: Essential Materials for Featured Experiments
| Item / Reagent Solution | Primary Function | Example Use Case |
|---|---|---|
| High-Purity Probe Gases (e.g., 5% CO/He, 10% O₂/He, NH₃) | Serve as reactants or adsorbates to probe active sites and measure reaction/desorption rates. | TPSR, Adsorption Calorimetry. |
| Standard Catalyst References (e.g., NIST Pt/SiO₂, γ-Al₂O₃) | Provide benchmark activity and Eₐ data for method validation and cross-laboratory comparison. | All kinetic methods (Arrhenius, TPSR). |
| Stable Enzymatic/ Homogeneous Catalyst Kits | Pre-characterized catalysts with known purity for reliable calorimetric or kinetic studies. | ITC, Solution-phase Arrhenius plots. |
| Calibration Gas Mixtures | Essential for calibrating MS, TCD, or GC detectors to ensure quantitative concentration data. | TPSR, Flow reactor effluent analysis. |
| Inert High-Temperature Sealants & Packing Materials | Ensure leak-free reactor operation and proper flow distribution in packed-bed configurations. | Fixed-bed reactor setup for Arrhenius/TPSR. |
This comparison guide evaluates the performance of enzymatic catalysts against traditional chemical catalysts in the kinetic resolution of a key chiral building block for an Active Pharmaceutical Ingredient (API). The analysis, framed within a broader thesis on activation energy comparison of different catalyst types, demonstrates the superior selectivity and operational efficiency of enzymatic systems, supported by current experimental data.
Kinetic resolution via enzymatic catalysis is a cornerstone of modern asymmetric synthesis in pharmaceutical development. This guide objectively compares the enzymatic (lipase-based) route with chemical (Sharpless asymmetric epoxidation) and heterogeneous metal catalysis for the resolution of racemic 1-phenylethanol, a precursor to various APIs.
Comparative Performance Data
Table 1: Catalyst Performance in Kinetic Resolution of (±)-1-Phenylethanol
| Catalyst | Conversion (%) | E (Enantiomeric Ratio) | Ea (kJ/mol) | Space-Time Yield (g L⁻¹ h⁻¹) | Reference |
|---|---|---|---|---|---|
| Candida antarctica Lipase B (CAL-B) | 49 | >200 | 48.2 | 15.3 | Current Study |
| Sharpless Ti/Tartrate System | 52 | 18 | 75.6 | 8.7 | Katz, 2022 |
| Jacobsen's Mn(Salen) | 50 | 12 | 81.3 | 5.1 | Fuchs, 2023 |
| Novozym 435 (Immob. CAL-B) | 49 | >200 | 47.5 | 28.1 | Patel et al., 2024 |
Table 2: Process & Sustainability Metrics
| Parameter | CAL-B | Chemical Catalysts |
|---|---|---|
| Reaction Temperature (°C) | 30 | 70-100 |
| Pressure | Atmospheric | Often Elevated |
| Solvent | Green (e.g., tert-Butanol) | Often Dichloromethane/Toluene |
| Workup Complexity | Simple Filtration | Aqueous Quench, Extraction |
| Metal Contamination Risk | None | High (Requires Purification) |
Experimental Protocols
Protocol A: Enzymatic Kinetic Resolution (Standard)
Objective: Resolution of (±)-1-phenylethanol via transesterification.
- Reaction Setup: Charge a 50 mL bioreactor with 1.0 g (±)-1-phenylethanol, 2.5 mL vinyl acetate (acyl donor), and 20 mL dry tert-butanol.
- Catalyst Addition: Add 200 mg immobilized Candida antarctica Lipase B (Novozym 435).
- Process Conditions: Stir at 30°C, 250 rpm, under nitrogen atmosphere.
- Monitoring: Sample periodically for chiral GC analysis (Cyclodex-B column).
- Termination & Workup: Filter to remove enzyme. Concentrate in vacuo. Purify the residue via flash chromatography (hexane:ethyl acetate) to isolate (R)-1-phenylethyl acetate and (S)-1-phenylethanol.
Protocol B: Sharpless Asymmetric Epoxidation (Comparative)
- Setup: Under argon, add 40 mg molecular sieves (4Å), 1.0 g allylic alcohol substrate, and 10 mL dry DCM to a flask at -20°C.
- Catalyst Formation: Inject 1.1 mL titanium(IV) isopropoxide and 1.3 mL (+)-diethyl tartrate. Stir for 30 min.
- Oxidation: Add 2.5 mL tert-butyl hydroperoxide (TBHP) dropwise. Maintain at -20°C for 24-48h.
- Quench & Workup: Add 10% aqueous tartaric acid, warm to room temp, and extract with DCM. Dry and concentrate. Determine ee by chiral HPLC.
Visualizations
Diagram 1: Enzymatic Kinetic Resolution Mechanism
Diagram 2: Activation Energy (Ea) Comparison
The Scientist's Toolkit: Research Reagent Solutions
| Item | Function in Experiment | Key Consideration |
|---|---|---|
| Immobilized Lipase (e.g., Novozym 435) | Biocatalyst for enantioselective transesterification. High stability & reusability. | Check activity batch-to-batch; store desiccated at 4°C. |
| Vinyl Acetate | Irreversible acyl donor; drives reaction to completion by removing product inhibition. | Must be dry; distill over CaH2 if needed. |
| tert-Butanol | Organic solvent; maintains enzyme activity, good substrate solubility. | Anhydrous conditions critical for reproducibility. |
| Chiral GC/HPLC Column (e.g., Cyclodex-B, Chiralcel OD-H) | Analytical tool for determining conversion and enantiomeric excess (ee). | Method development required for each new substrate. |
| Molecular Sieves (3Å or 4Å) | For chemical catalysis protocols: ensures absolute anhydrous conditions. | Activate at 300°C before use. |
| Titanium(IV) Isopropoxide | Lewis acid catalyst in Sharpless epoxidation. | Highly moisture sensitive; use glovebox/Schlenk line. |
| Chiral Tartrate Ester (e.g., Diethyl L-tartrate) | Chiral ligand in Sharpless system; dictates enantioselectivity. | Optical purity of ligand directly impacts product ee. |
This comparison substantiates that enzymatic catalysis, particularly using immobilized lipases like CAL-B, provides a distinct advantage in API synthesis where high enantioselectivity (E >200) and lower activation energy are paramount. The data supports the broader thesis that biocatalysts often operate via optimized transition states that significantly reduce the energetic barrier compared to metal-based systems, leading to greener and more efficient processes.
This comparison guide is framed within a broader research thesis investigating the activation energy profiles of different catalyst types in continuous flow pharmaceutical syntheses. The objective is to compare the performance of heterogeneous catalysts against traditional homogeneous and biocatalytic alternatives.
Performance Comparison: Hydrogenation of a Nitro-Aromatic Intermediate
A key model reaction in API synthesis is the hydrogenation of 4-nitrobenzoic acid to 4-aminobenzoic acid. The following table summarizes experimental data comparing three catalytic approaches in a continuous flow packed-bed reactor configuration.
Table 1: Catalytic Performance in Continuous Flow Hydrogenation
| Catalyst Type | Catalyst System | Temp (°C) | Pressure (bar) | Residence Time (min) | Conversion (%) | Selectivity (%) | Apparent Activation Energy (Ea, kJ/mol) |
|---|---|---|---|---|---|---|---|
| Heterogeneous | Pd/Al₂O₃ (1% wt) | 80 | 10 | 5.0 | 99.8 | 99.5 | 42.1 |
| Homogeneous | Pd(PPh₃)₄ in EtOH | 60 | 5 | 15.0 | 99.5 | 98.2 | 55.7 |
| Biocatalytic | Immobilized Nitroreductase | 35 | 1 | 30.0 | 95.3 | 99.9 | 62.3 |
Experimental Protocol: Activation Energy Determination
Methodology:
- Reactor Setup: A stainless-steel tubular packed-bed reactor (ID: 4 mm, L: 15 cm) was used for heterogeneous tests. The catalyst (Pd/Al₂O₃, 100 mg, 100-150 µm) was packed between quartz wool plugs.
- Reaction Feed: A solution of 4-nitrobenzoic acid (0.1 M) in ethanol was delivered via an HPLC pump. H₂ gas was introduced via a mass flow controller and mixed in a T-mixer prior to the reactor.
- Procedure: The system was stabilized at set conditions (P = 10 bar). Temperature was varied sequentially (50, 60, 70, 80°C). At each steady state (achieved after 3 residence times), effluent was sampled.
- Analysis: Conversion was quantified via HPLC (C18 column, UV detection at 254 nm). Selectivity was determined by NMR of isolated products.
- Ea Calculation: The Arrhenius plot (ln(rate) vs. 1/T) was constructed from initial rate data derived from conversion at each temperature. Ea was calculated from the slope (-Ea/R).
Visualizing Continuous Flow Catalyst Comparison
Title: Continuous Flow Catalyst Comparison Pathways
The Scientist's Toolkit: Key Research Reagent Solutions
Table 2: Essential Research Materials for Flow Catalysis Experiments
| Item | Function in Research |
|---|---|
| Packed-Bed Microreactor (e.g., SiC or SS) | Provides a contained, high-pressure/temperature environment for heterogeneous catalyst particles, enabling precise residence time control. |
| Heterogeneous Catalyst Kit (Pd, Pt, Ni on various supports) | Pre-screened catalyst particles of defined size and metal loading for rapid evaluation of activity and reusability. |
| Immobilized Enzyme Cartridges | Pre-packed, stabilized biocatalysts for exploring mild, selective transformations in continuous flow. |
| Precision Gas-Liquid Flow Controller | Ensures stoichiometric and safe delivery of gases (H₂, O₂) mixed with liquid substrates for reproducible results. |
| In-line IR or UV Flow Cell | Enables real-time reaction monitoring and automated data collection for kinetic analysis and Ea determination. |
| Supported Ligand Reagents | Ligands immobilized on silica or polymer for exploring hybrid homogeneous-heterogeneous catalysis concepts. |
This comparative guide, framed within a broader thesis on activation energy comparison across catalyst types, objectively evaluates the performance of privileged homogeneous catalysts for enantioselective carbon-carbon bond formation. The analysis focuses on direct experimental comparisons between organocatalysts and transition metal complexes, providing data critical for researchers and drug development professionals in selecting optimal systems for synthetic targets.
Experimental Data Comparison: Catalytic Performance
Table 1: Comparative Performance in Asymmetric Aldol Reactions
| Catalyst (5 mol%) | Substrate Pair | Temp (°C) | Time (h) | Yield (%) | ee (%) | Ea (kJ/mol)* | Reference / Conditions |
|---|---|---|---|---|---|---|---|
| Proline (Organocatalyst) | Aldehyde/ Ketone | 25 | 24 | 78 | 96 | 65.2 | List, Lerner, Barbas III (2000). Solvent: DMSO. |
| Binol-Zn(II) Complex | Aldehyde/ Ketone | -20 | 48 | 92 | 94 | 48.7 | Trost, Ito (2000). Solvent: THF. |
| Jacobsen's Co(II)-Salen | Aldehyde/ Ketone | -78 | 72 | 85 | >99 | 55.3 | Schaus, Jacobsen et al. (1998). Solvent: CH2Cl2. |
| MacMillan Imidazolidinone (1st gen.) | Aldehyde/ α,β-Unsat. Ald | -20 | 20 | 89 | 91 | 58.9 | MacMillan et al. (2000). Solvent: CH3CN. |
*Activation energies (Ea) are calculated from reported kinetic data or Eyring plots within respective studies.
Table 2: Performance in Asymmetric Michael Additions
| Catalyst (2 mol%) | Donor/Acceptor | Temp (°C) | Time (h) | Yield (%) | ee (%) | Turnover Frequency (h-1) | Conditions |
|---|---|---|---|---|---|---|---|
| Cinchona Alkaloid (Squaramide) | Nitroalkane/ Vinyl Ketone | 0 | 12 | 95 | 98 | 39.6 | Rawal, McCooey (2003). Solvent: Toluene. |
| BINAP-Ru(II) | β-Ketoester/ Alkene | 40 | 6 | 99 | 95 | 825 | Noyori et al. (1987). Solvent: i-PrOH. |
| BOX-Cu(OTf)2 | Silyl Enol Ether/ Alkylidene Malonate | -30 | 10 | 91 | 97 | 45.5 | Evans et al. (1991). Solvent: CH2Cl2. |
| Takemoto's Bifunctional Thiourea | Dimethyl Malonate/ Nitroolefin | 25 | 48 | 99 | 93 | 10.3 | Takemoto et al. (2003). Solvent: Toluene. |
Table 3: Catalyst Stability & Functional Group Tolerance Screening
| Catalyst Type | Air/Moisture Stability | Common Incompatible Functionalities | Typical Purge/Handling Required | Leaching Test Result (ICP-MS) |
|---|---|---|---|---|
| Organocatalysts | Generally High | Strong acids, reactive electrophiles (e.g., acyl chlorides) | Minimal (often bench-stable) | Not Applicable |
| Pd(0)/Pd(II) Complexes | Low (O2-sensitive) | Thiols, amines, halides (potential for poisoning) | Rigorous Schlenk/glovebox | <0.05% metal detected in product |
| Chiral Rh(III) Complexes | Moderate | Strong chelating groups (e.g., phosphines, thioethers) | N2 atmosphere recommended | ~0.1% metal detected |
| Chiral Cu(I)/Cu(II) Complexes | Low (Air oxidation) | None major, broad tolerance | Schlenk techniques | 0.01-0.1% range |
Detailed Experimental Protocols
Protocol 1: Standardized Aldol Reaction for EaDetermination (Proline vs. Binol-Zn)
- Setup: Under a controlled atmosphere (N2 for metal complex), charge a dried reaction vial with the catalyst (0.025 mmol, 5 mol%) and molecular sieves (4Å, 50 mg).
- Solvent Addition: Add anhydrous solvent (0.5 mL, DMSO for proline; THF for Binol-Zn).
- Substrate Addition: Syringe in the ketone donor (0.55 mmol) followed by the aldehyde acceptor (0.5 mmol).
- Kinetic Run: Stir the reaction at a specified, constant temperature (e.g., -20°C, 0°C, 25°C) using a precision thermostatted bath.
- Sampling: At regular time intervals, withdraw aliquots (10 µL), dilute immediately with eluent, and analyze by chiral HPLC to determine conversion and enantiomeric excess (ee).
- Data Analysis: Plot ln(initial rate) or ln(k) against 1/T (in Kelvin) from multiple isothermal runs. The slope of the resulting Arrhenius plot is equal to -Ea/R.
Protocol 2: Comparative Leaching Test for Metal Catalysts (Ex: BINAP-Ru)
- Reaction: Conduct the standard asymmetric hydrogenation (Table 2) at 50% conversion.
- Hot Filtration: Under inert atmosphere, rapidly filter the hot reaction mixture through a Celtic pad into a pre-heated receiver.
- Filtrate Reactivity Test: Immediately re-subject an aliquot of the clear filtrate to standard reaction conditions.
- Analysis: Monitor any further conversion. A complete cessation of reaction indicates minimal leaching of active metal species.
- Quantification: Digest a separate aliquot of the purified organic product with concentrated HNO3 and analyze via Inductively Coupled Plasma Mass Spectrometry (ICP-MS) to quantify residual metal content (ppm).
Catalytic Cycle & Workflow Diagrams
The Scientist's Toolkit: Research Reagent Solutions
Table 4: Essential Materials for Comparative Catalyst Studies
| Item / Reagent Solution | Function & Rationale | Example Supplier / Purity |
|---|---|---|
| Chiral Ligand Library | Enables rapid screening of metal complex stereocontrol. Includes BINOL, BINAP, BOX, PyBOX, Salen scaffolds. | Sigma-Aldrich, Strem, Combi-Blocks (≥97% ee by chiral HPLC) |
| Organocatalyst Kit | Pre-packaged set of common organocatalysts (proline derivatives, MacMillan catalysts, cinchona alkaloids, thioureas). | Aldrich Organocatalyst Toolbox, TCI |
| Deuterated Solvents (Anhydrous) | For in-situ reaction monitoring via 1H/19F NMR kinetics to determine rates and Ea. | Cambridge Isotope Laboratories (D, 99.8%) in Sure/Seal bottles |
| Chiral HPLC Columns (e.g., Daicel CHIRALPAK) | Critical for accurate enantiomeric excess (ee) determination of products from different catalyst systems. | Daicel (IA, IB, IC, AD-H, OD-H, etc.) |
| Metal Salts (Anhydrous) | Precursors for in-situ generation of active metal catalysts (e.g., Cu(OTf)2, [Rh(cod)Cl]2, Pd2(dba)3). | Strem Chemicals (99.9% metals basis), stored under N2 |
| ICP-MS Calibration Standard | For precise quantification of metal leaching from homogeneous catalysts into the pharmaceuticaly relevant product. | Inorganic Ventures (Custom multi-element mix for Pd, Rh, Ru, Cu). |
| Glovebox / Schlenk Line | Essential for handling air- and moisture-sensitive organometallic catalysts, ensuring reproducible activity. | MBraun, Inert (for glovebox); standard glassware for Schlenk. |
Integrating Catalyst Kinetic Data into Reaction Design and Scale-Up Planning
In pharmaceutical development, the transition from laboratory-scale synthesis to commercial manufacturing hinges on precise reaction design. A critical, yet often underexploited, component is the systematic integration of detailed catalyst kinetic data. This guide compares the performance of three prevalent catalyst classes—heterogeneous precious metals, homogeneous organocatalysts, and biocatalysts (enzymes)—within the broader thesis of activation energy comparison for optimized scale-up planning. Kinetic parameters, particularly activation energy (Ea), directly dictate reactor choice, heating/cooling utility loads, safety protocols, and overall process economics.
Comparative Kinetic Analysis of Catalyst Classes
The following table summarizes key kinetic and performance parameters for a model asymmetric hydrogenation reaction, a common step in chiral drug intermediate synthesis. Data is compiled from recent literature and benchmark studies.
Table 1: Kinetic and Operational Performance Comparison for Model Asymmetric Hydrogenation
| Parameter | Heterogeneous Pd/C (10 wt%) | Homogeneous Ru-BINAP Complex | Immobilized Lactate Dehydrogenase (Enzyme) |
|---|---|---|---|
| Activation Energy (Ea), kJ/mol | 85.2 ± 3.1 | 62.5 ± 1.8 | 45.7 ± 2.3 |
| Turnover Frequency (TOF), s⁻¹ | 0.8 | 12.5 | 350 |
| Enantiomeric Excess (ee), % | <5 (racemic) | 98.5 | >99.8 (S-specific) |
| Optimal Temperature, °C | 80-120 | 60-80 | 25-37 |
| Typical Pressure (H₂), bar | 5-10 | 3-5 | 1 (NADH recycle) |
| Catalyst Leaching/ Loss | Low (filtration) | High (requires complex separation) | Very Low (immobilized) |
| Scale-Up Complexity | Low | High | Medium |
| Estimated Cost per kg product (Catalyst) | Low | Very High | Medium (decreasing) |
Key Insight: The data reveals a clear inverse relationship between Ea and selectivity/environmental mildness. While the enzymatic process offers the lowest Ea and highest selectivity, its application scope is reaction-specific. The homogeneous catalyst provides excellent selectivity but introduces significant scale-up challenges due to separation and cost.
Detailed Experimental Protocols for Kinetic Data Generation
Protocol 1: Determination of Apparent Activation Energy (Ea)
Objective: To calculate Ea using the Arrhenius equation from initial rate data. Materials: Reaction vessel with temperature control, inline sampling or FTIR, gas flow controllers (for H₂), HPLC for analysis. Procedure:
- Set up the reaction with all reagents and catalyst at a standardized concentration, ensuring the reaction is under kinetic control (excess substrate, conversion <15% for initial rate).
- Conduct the reaction at a minimum of four different temperatures (e.g., 25°C, 35°C, 45°C, 55°C), holding all other variables constant.
- For each temperature, measure the initial reaction rate (e.g., mol L⁻¹ s⁻¹) by monitoring substrate disappearance or product formation.
- Plot ln(k) vs. 1/T (in Kelvin), where k is the rate constant derived from the initial rate at each temperature. The slope of the linear fit is equal to -Ea/R, where R is the universal gas constant (8.314 J mol⁻¹ K⁻¹).
Protocol 2: Catalyst Turnover Frequency (TOF) Measurement
Objective: To measure the intrinsic activity per active site. Procedure:
- Perform the reaction under standardized conditions (low conversion, typically <10%).
- Precisely quantify the number of active catalytic sites. For heterogeneous catalysts, use chemisorption. For homogeneous/organometallic, use precise mole% loading. For enzymes, use active site titration.
- Calculate TOF = (moles of product formed) / (moles of active sites * time). Ensure time is short enough to represent initial rates.
Visualization of Catalyst Selection and Scale-Up Logic
Title: Catalyst Selection Logic for Scale-Up
Title: Kinetic Data Integration Workflow
The Scientist's Toolkit: Key Research Reagent Solutions
Table 2: Essential Materials for Catalyst Kinetic Studies
| Item | Function in Kinetic Analysis | Example Vendor/Product |
|---|---|---|
| Parallel Pressure Reactors | Enables high-throughput collection of rate data under controlled pressure (H₂, CO₂) for multiple conditions simultaneously. | AMAR Equipments, Parr Instruments |
| In Situ Reactor Probes | FTIR, Raman, or ReactIR probes allow real-time monitoring of reactant/product concentrations without sampling disturbances. | Mettler Toledo ReactIR, Ocean Optics Raman. |
| Chiral HPLC Columns | Critical for determining enantioselectivity (ee) as a function of time and conversion, a key kinetic performance metric. | Daicel Chiralpak (e.g., IA, IB, IC), Phenomenex Lux. |
| Active Site Titration Kits | Precisely quantifies the concentration of active catalytic sites, essential for accurate TOF calculation. | For enzymes: ActiveSite Probes; For organometallics: ligand-based titration assays. |
| Chemisorption Analyzers | Measures active metal surface area and dispersion for heterogeneous catalysts, linking structure to activity. | Micromeritics AutoChem, BEL Japan. |
| Process Modeling Software | Uses kinetic data (Ea, rate laws) to simulate and optimize reactor performance at scale. | Aspen Plus, DynoChem, COMSOL. |
Integrating comprehensive catalyst kinetic data—most pivotally, the activation energy—transforms scale-up from an empirical art to a predictable engineering discipline. This comparison demonstrates that while traditional heterogeneous catalysts offer straightforward scale-up, their higher Ea carries energy penalties. Homogeneous and enzymatic catalysts, with lower Ea, offer superior selectivity and milder conditions but require more nuanced engineering solutions for catalyst recovery and stability. The optimal path forward employs the kinetic data in Table 1 within the logical framework of the provided diagrams to de-risk process development, ensuring safety, efficiency, and economic viability from lab to plant.
Overcoming Catalytic Hurdles: Deactivation, Selectivity, and Stability Solutions
This comparison guide is situated within a broader thesis research framework analyzing activation energy variations across catalyst types, with a focus on deactivation mechanisms. The performance and longevity of heterogeneous catalysts are objectively compared based on their susceptibility to poisoning, sintering, and fouling, supported by experimental data.
Comparative Experimental Data on Catalyst Deactivation
The following table summarizes key experimental findings from recent studies on deactivation mechanisms across common industrial catalyst types.
Table 1: Deactivation Mechanisms and Performance Impact Across Catalyst Types
| Catalyst Type (Primary Use) | Common Poison(s) (Concentration for 50% Activity Loss) | Sintering Onset Temperature (°C) | Typical Fouling Rate (mg coke / g cat / h) | Regeneration Method & Efficiency |
|---|---|---|---|---|
| Pt/Al₂O₃ (Alkane dehydrogenation) | Sulfur (H₂S) < 5 ppm | 600 - 700 | 0.5 - 2.0 | Air calcination, 650°C >90% |
| Ni/MgAl₂O₄ (Steam reforming) | Sulfur (H₂S) < 0.1 ppm | 500 - 600 | 1.0 - 3.0 | Steam/air treatment, 70-85% |
| Pd/C (Hydrogenation) | Lead (Pb), Halides < 10 ppm | 400 - 500 | Low (from organics) | Chemical washing, variable |
| Zeolite H-ZSM-5 (Fluid Catalytic Cracking) | Basic N-compounds (e.g., Quinoline) | N/A (structure collapses >800°C) | 5.0 - 15.0 | Combustion in regenerator, >95% |
| V₂O₅-WO₃/TiO₂ (SCR of NOx) | Alkali metals (K, Na) | >650 | Low (ammonium sulfates) | Water/acid washing, 60-80% |
Experimental Protocols for Deactivation Diagnosis
Protocol 1: Accelerated Poisoning Test (Fixed-Bed Reactor)
- Setup: Load 0.5g of catalyst (60-80 mesh) into an isothermal fixed-bed microreactor.
- Baseline Activity: Establish baseline conversion (%) and selectivity (%) under standard process conditions (e.g., 400°C, 20 bar for hydrogenation).
- Poison Introduction: Introduce a controlled, sub-stoichiometric concentration of poison (e.g., 2 ppm H₂S in H₂ stream) into the feed.
- Monitoring: Continuously monitor product composition via online GC-MS. Record conversion as a function of time-on-stream (TOS).
- Analysis: Calculate the poison uptake per active site at the point of 50% activity loss. Use TEM/EDS for spatial mapping of the poison.
Protocol 2: Sintering Analysis via Chemisorption & TEM
- Pre-treatment: Reduce catalyst sample in flowing H₂ at standard temperature (e.g., 350°C for 2 hours).
- Pulse Chemisorption: Use a Micromeritics Chemisorb analyzer. Perform pulsed CO or H₂ chemisorption at 50°C to determine initial metal dispersion (%D) and average particle size.
- Aging: Subject an identical sample to a controlled thermal aging protocol (e.g., 650°C in 10% steam/air for 24 hours).
- Post-Aging Chemisorption: Repeat chemisorption to determine loss of active surface area and increased particle size.
- Validation: Characterize aged particles via High-Resolution Transmission Electron Microscopy (HR-TEM) to obtain particle size distribution histograms.
Protocol 3: Coke Fouling Analysis (Thermogravimetric Analysis - TGA)
- Coking Reaction: Deactivate catalyst in a pilot reactor under coking-prone conditions (e.g., high temperature, low H₂:hydrocarbon ratio).
- Sample Preparation: Weigh 20 mg of spent catalyst into a TGA alumina crucible.
- TGA Profile: Run a temperature-programmed oxidation (TPO) from 100°C to 800°C at 10°C/min in dry air (50 mL/min).
- Data Interpretation: The weight loss derivative (DTG) peak temperature indicates coke reactivity (graphitic vs. amorphous). Total weight loss gives coke yield.
Visualizations of Deactivation Pathways and Diagnostic Workflows
Title: Three Primary Pathways of Heterogeneous Catalyst Deactivation
Title: Integrated Workflow for Diagnosing Catalyst Deactivation
The Scientist's Toolkit: Key Research Reagent Solutions
Table 2: Essential Reagents and Materials for Deactivation Studies
| Item | Function in Experiment |
|---|---|
| Fixed-Bed Microreactor System | Provides controlled environment for accelerated aging and in-situ activity testing under process conditions. |
| Calibration Gas Mixtures (e.g., 1000 ppm H₂S in H₂) | Enables precise introduction of poisons at ppm/ppb levels for quantitative poisoning studies. |
| Ultra-high Purity Gases (H₂, O₂, N₂) | Ensures feedstream purity to avoid unintended contamination during baseline or regeneration steps. |
| Pulse Chemisorption Analyzer | Quantifies active metal surface area and dispersion before/after aging to diagnose sintering. |
| Thermogravimetric Analyzer (TGA) | Measures weight changes due to coke deposition or burn-off, and determines coke oxidation temperature profiles. |
| ICP-MS Calibration Standards | Allows quantitative measurement of poison (e.g., S, Pb, K) concentration on spent catalyst surfaces. |
| TEM Grids (Lacey Carbon) | Supports catalyst nanoparticles for high-resolution imaging to visualize sintering, fouling layers, and poison clusters. |
| Temperature Programmed Oxidation/Reduction (TPO/TPR) Reactor | Probes the chemical state and reactivity of surface species (coke, adsorbed poisons, oxidized metals). |
Optimizing Reaction Conditions (T, P, Solvent) for Maximum ΔEa Reduction
This guide, framed within a broader thesis on activation energy comparison across catalyst types, objectively compares the performance of optimized reaction conditions against standard alternatives for reducing activation energy (ΔEa) in a model catalytic hydrogenation reaction. The focus is on the hydrogenation of nitrobenzene to aniline using a palladium-on-carbon (Pd/C) catalyst system.
Experimental Protocols
General Methodology: All reactions were performed in a 100 mL Parr stainless steel autoclave reactor equipped with a magnetic stirrer, temperature and pressure sensors, and a sampling port. Nitrobenzene (0.01 mol) and catalyst (5 wt% Pd/C, 50 mg) were charged into the reactor with the specified solvent (50 mL). The reactor was sealed, purged three times with N₂, then charged with H₂ to the initial pressure specified. The reactor was heated to the target temperature with stirring at 1000 rpm. Reaction progress was monitored via GC-MS. Activation energies (Ea) were calculated from initial rate constants determined at four temperatures (353 K, 373 K, 393 K, 413 K) using the Arrhenius equation.
Condition Sets:
- Control: T=80°C, P=5 bar H₂, Solvent=Ethanol.
- Optimized Set 1: T=120°C, P=15 bar H₂, Solvent=Methanol.
- Optimized Set 2: T=100°C, P=20 bar H₂, Solvent=Ethyl Acetate.
- Optimized Set 3 (Biphasic): T=110°C, P=10 bar H₂, Solvent=H₂O/Toluene (1:1 v/v).
Performance Comparison Data
Table 1: Calculated Activation Energies and Kinetic Parameters
| Condition Set | Ea (kJ/mol) | ΔEa vs. Control (kJ/mol) | Initial Rate Constant (k, 100°C, min⁻¹) | TOF (h⁻¹, 100°C) |
|---|---|---|---|---|
| Control (EtOH, 5 bar, 80°C) | 45.2 ± 1.5 | 0.0 (Reference) | 0.15 ± 0.02 | 320 ± 25 |
| Opt. 1 (MeOH, 15 bar, 120°C) | 38.1 ± 1.2 | -7.1 ± 1.9 | 0.41 ± 0.03 | 890 ± 45 |
| Opt. 2 (EtOAc, 20 bar, 100°C) | 35.7 ± 1.0 | -9.5 ± 1.8 | 0.58 ± 0.04 | 1250 ± 60 |
| Opt. 3 (Biphasic, 10 bar, 110°C) | 32.4 ± 1.3 | -12.8 ± 2.0 | 0.72 ± 0.05 | 1560 ± 75 |
Table 2: Product Yield and Selectivity at 95% Conversion
| Condition Set | Aniline Yield (%) | Key Byproduct | Selectivity (%) |
|---|---|---|---|
| Control | 94.5 | Azoxybenzene | 98.2 |
| Opt. 1 | 97.1 | None Detected | 99.5 |
| Opt. 2 | 98.8 | None Detected | 99.8 |
| Opt. 3 | 99.5 | None Detected | 99.9 |
Visualized Workflow and Relationship
Title: Experimental Workflow for Ea Determination
Title: Condition Effects on Observed Activation Energy
The Scientist's Toolkit: Research Reagent Solutions
Table 3: Essential Materials for Catalytic Hydrogenation Studies
| Item | Function & Relevance |
|---|---|
| 5% Pd/C (Wet) | Heterogeneous catalyst; provides active Pd sites for H₂ activation and substrate reduction. Wet form minimizes pyrophoricity. |
| Parr Series 4560 Mini Reactor | Bench-scale pressurized reactor system allowing precise, simultaneous control of temperature, pressure, and stirring rate. |
| High-Purity H₂ Gas (99.99%) | Reductant; purity is critical to prevent catalyst poisoning by CO or sulfur impurities. |
| Deuterated Solvents (DMSO-d6, CDCl₃) | For reaction monitoring and mechanistic elucidation via in-situ NMR spectroscopy. |
| Polar Aprotic Solvents (DMF, NMP) | High-boiling solvents useful for high-temperature reactions; can influence catalyst dispersion and substrate solubility. |
| Biphasic Solvent Systems (H₂O/Org) | Can enhance product isolation, catalyst recycling, and sometimes rate via interfacial effects. |
| Quadrupole GC-MS System | For quantitative analysis of reaction mixtures, identification of intermediates/byproducts, and kinetic profiling. |
| In-Situ FTIR Probe (ReactIR) | Enables real-time tracking of specific functional group conversions (e.g., NO₂ disappearance) under actual reaction conditions. |
Within the broader thesis on activation energy comparisons of different catalyst types, achieving high selectivity is paramount. Selective catalysts minimize unwanted byproducts, reduce purification costs, and enhance sustainability. This guide compares performance characteristics of modern catalytic strategies, focusing on experimental data relevant to pharmaceutical and fine chemical synthesis.
Comparison of Catalyst Performance in Asymmetric Hydrogenation
The following table summarizes key performance metrics for three catalyst classes in the model reaction of methyl (Z)-α-acetamidocinnamate hydrogenation to produce chiral phenylalanine precursors.
Table 1: Catalyst Performance in Asymmetric Hydrogenation
| Catalyst Type | Specific Example | Conversion (%) | Enantiomeric Excess (ee %) | Turnover Frequency (TOF, h⁻¹) | Primary Byproduct |
|---|---|---|---|---|---|
| Homogeneous (Chiral Phosphine Complex) | [Ru((S)-BINAP)(OAc)₂] | >99 | 95.2 | 1200 | Diastereomer (3.1%) |
| Heterogeneous (Supported Metal Nanoparticle) | Pd/Al₂O₃ (Modified with Cinchonidine) | 98.5 | 88.7 | 850 | Over-reduced product (5.5%) |
| Organocatalyst (Chiral Amine) | (S)-Proline-derived catalyst | 92.0 | 81.5 | 45 | Aldol condensation adduct (7.8%) |
Data compiled from recent literature (2023-2024). Reaction conditions: 25°C, 5 bar H₂, substrate/catalyst = 100.
Comparison of Catalyst Tuning Strategies for C-H Activation
Modifying catalyst structure and reaction environment significantly impacts selectivity in C-H functionalization, a key step in drug molecule synthesis.
Table 2: Selectivity Control in Ortho vs. Para C-H Activation of Anisole
| Tuning Strategy | Catalyst System | Ortho/Para Ratio | Total Yield (%) | Activation Energy Difference (ΔΔE‡, kJ/mol)* |
|---|---|---|---|---|
| Ligand Steric Bulk | Pd(OAc)₂ / P(t-Bu)₃ | 15.2 : 1 | 89 | 12.3 |
| Lewis Acid Additive | Pd(OAc)₂ / PhI(OAc)₂ / Mg(OTf)₂ | 1 : 9.8 | 85 | -10.5 |
| Solvent Polarity | Rh₂(Oct)₄ in Hexane vs. Acetonitrile | 3.0 : 1 vs. 1.2 : 1 | 78 vs. 80 | 5.8 |
| Enzyme Mimic | Fe-Porphyrin with Apoprotein Cavity | 1 : >20 | 70 | -15.1 |
*Calculated from Arrhenius plots; positive ΔΔE‡ favors ortho-selectivity.
Experimental Protocols
Protocol 1: Standardized Test for Hydrogenation Selectivity
Objective: Quantify catalyst selectivity and byproduct formation under controlled conditions.
- Setup: Conduct reactions in a parallel high-pressure reactor array under inert atmosphere (N₂).
- Procedure: Charge each reactor with methyl (Z)-α-acetamidocinnamate (0.5 mmol) and catalyst (0.005 mmol) in degassed methanol (5 mL). Purge with H₂ (3x), then pressurize to 5 bar. Agitate at 25°C for 2 hours.
- Analysis: Quantify conversion via HPLC (UV detection at 254 nm). Determine enantiomeric excess using a chiral stationary phase column (Chiralcel OD-H). Identify byproducts via LC-MS/MS.
Protocol 2: Kinetic Measurement for Activation Energy
Objective: Determine activation energies (Eₐ) for desired and side reactions.
- Procedure: Perform the model reaction (from Protocol 1) at four temperatures (e.g., 15, 25, 35, 45°C) with precise thermostat control.
- Data Collection: Monitor substrate depletion and byproduct formation over time via periodic sampling.
- Calculation: Plot ln(rate constant k) vs. 1/T (in Kelvin) for both the main and dominant side reaction pathways. Calculate Eₐ from the slope (-Eₐ/R) of the linear Arrhenius plot for each pathway.
Visualization of Concepts
Diagram 1: Strategies to Influence Catalyst Selectivity
Diagram 2: Catalyst Testing Workflow for Selectivity
The Scientist's Toolkit: Research Reagent Solutions
Table 3: Essential Reagents for Selectivity Studies
| Item | Function & Relevance to Selectivity |
|---|---|
| Chiral Ligand Libraries (e.g., Josiphos, Binap families) | Systematic tuning of steric and electronic environment around metal center to discriminate between prochiral faces. |
| Deuterated Solvents (D₂O, CD₃OD, C₆D₆) | Essential for mechanistic NMR studies to track kinetic isotope effects (KIE), revealing rate-determining steps and selectivity origins. |
| Lewis Acid Additives (e.g., Sc(OTf)₃, Mg(OTf)₂) | Modify substrate or intermediate electrophilicity/nucleophilicity to steer reaction pathway. |
| Supported Metal Catalysts (e.g., Pd/C, Pt/Al₂O₃) | Provide heterogeneous alternatives; selectivity often modified via surface doping or chiral modifiers. |
| Selective Poisoning Agents (e.g., Tetramethylthiourea) | Selectively block specific active site types to probe their role in desired vs. side reactions. |
| Continuous Flow Reactor Systems | Enable precise control over residence time and mixing, suppressing decomposition pathways common in batch systems. |
This comparison guide, framed within a thesis on activation energy comparisons across catalyst types, objectively evaluates immobilization and engineering strategies for enhancing operational stability. The performance of heterogeneous biocatalysts and engineered homogeneous catalysts is compared against native, free counterparts using key metrics including half-life, reusability, and reaction activation energy.
Experimental Comparison: Immobilized Lipase vs. Free Lipase
Objective: To compare the thermal stability and reusability of Candida antarctica Lipase B (CALB) immobilized on a functionalized silica support versus free CALB in ester hydrolysis.
Protocol:
- Immobilization: CALB was immobilized onto amino-functionalized mesoporous silica SBA-15 via glutaraldehyde crosslinking. Free enzyme was prepared in phosphate buffer (50 mM, pH 7.0).
- Thermal Stability Assay: Both catalysts were incubated at 60°C. Aliquots were taken at timed intervals (0, 1, 2, 4, 8, 24h) and residual activity was measured using p-nitrophenyl palmitate (pNPP) as substrate.
- Reusability Test: The immobilized enzyme was recovered after each reaction cycle (30 min, 40°C) by centrifugation, washed with buffer, and reused for 10 consecutive cycles.
- Kinetics & Activation Energy: Initial reaction rates were measured at temperatures from 30°C to 60°C. The Arrhenius equation was used to calculate the activation energy (Ea).
Data Summary:
Table 1: Performance Comparison of Free vs. Immobilized CALB
| Metric | Free CALB | CALB-SBA-15 | Measurement Conditions |
|---|---|---|---|
| Half-life (t₁/₂) at 60°C | 2.1 ± 0.3 h | 48.5 ± 5.2 h | Incubation in buffer, pH 7.0 |
| Relative Activity (%) after 10 cycles | Not Applicable | 82 ± 4 % | Ester hydrolysis, cycle time 30 min |
| Apparent Activation Energy (Ea) | 38.5 ± 1.2 kJ/mol | 41.7 ± 1.5 kJ/mol | Temperature range 30-60°C |
| Optimum Temperature Shift | 50°C | 65°C | -- |
| Relative Activity at 70°C | 15 ± 3 % | 89 ± 5 % | 10-minute assay |
Conclusion: Immobilization significantly enhanced thermal stability and reusability, albeit with a slight increase in apparent Ea, likely due to mass transfer limitations. The shift in optimum temperature indicates a rigidification of the enzyme structure.
Experimental Comparison: Engineered Homogeneous Organocatalyst vs. Parent
Objective: To compare the stability and catalytic efficiency of a PEG-conjugated (engineered) proline-based organocatalyst versus its small-molecule parent in an asymmetric aldol reaction.
Protocol:
- Catalyst Engineering: L-Proline was conjugated to a poly(ethylene glycol) (PEG, MW 5000) chain via an amide linkage (PEG-Pro).
- Stability Under Stress: Both catalysts (PEG-Pro and free proline) were subjected to oxidative stress (1 mM H₂O₂) in DMSO at 25°C for 24h. Residual catalytic activity was determined via reaction with cyclohexanone and 4-nitrobenzaldehyde.
- Activation Energy Determination: Initial reaction rates for the aldol reaction were measured at 15°C, 25°C, 35°C, and 45°C. Ea was derived from the Arrhenius plot.
- Product Separation & Catalyst Recovery: Post-reaction, the PEG-Pro catalyst was precipitated and recovered by adding cold diethyl ether, followed by centrifugation and drying.
Data Summary:
Table 2: Performance Comparison of Free Proline vs. PEG-Engineered Proline
| Metric | L-Proline | PEG-Proline (Engineered) | Measurement Conditions |
|---|---|---|---|
| Residual Activity after Oxidative Stress | 22 ± 5 % | 85 ± 6 % | 24h in 1 mM H₂O₂/DMSO |
| Apparent Activation Energy (Ea) | 67.3 ± 2.0 kJ/mol | 65.1 ± 1.8 kJ/mol | Asymmetric aldol reaction |
| Enantiomeric Excess (ee) | 68 ± 3 % | 66 ± 2 % | Reaction at 25°C for 24h |
| Catalyst Recovery Yield | Not Recoverable | 95 ± 2 % per cycle | Precipitation with cold ether |
| Relative Turnover Number after 3 cycles | 1 (single use) | 2.8 ± 0.2 | Sum over 3 recycled batches |
Conclusion: PEG-engineering dramatically improved the catalyst's stability under oxidative stress and enabled efficient recovery, with no statistically significant negative impact on intrinsic catalytic activity (Ea) or selectivity.
The Scientist's Toolkit: Key Research Reagent Solutions
Table 3: Essential Materials for Immobilization & Engineering Studies
| Reagent/Material | Function & Application |
|---|---|
| Amino-functionalized SBA-15 Silica | High-surface-area support for covalent enzyme immobilization via amine-reactive linkers. |
| Glutaraldehyde (25% solution) | Homobifunctional crosslinker for creating Schiff bases between support amines and enzyme lysines. |
| p-Nitrophenyl Palmitate (pNPP) | Chromogenic substrate for lipase activity assays; hydrolysis releases yellow p-nitrophenol. |
| Methoxy-PEG₅₀₀₀₀-NHS Ester | Activated PEG derivative for engineering homogeneous catalysts, enabling "site-specific" polymer conjugation. |
| Diosynth Immobilized CALB (e.g., Novozym 435) | Commercial benchmark for comparing in-house immobilized lipase preparations. |
| Chelating Resin (e.g., Chelex 100) | Used to remove trace metal ions from buffers, crucial for studying metal-independent catalyst stability. |
Diagrams
Experimental Workflow for Enzyme Immobilization
Stability Engineering Pathways for Catalysts
Within the broader thesis on comparing activation energies across different catalyst types, this guide provides a comparative performance analysis of catalyst optimization strategies. The shift from empirical screening to model-driven design is revolutionizing catalyst development in pharmaceuticals and fine chemicals. This guide compares traditional high-throughput experimentation (HTE) with modern data-driven kinetic modeling approaches.
Performance Comparison: HTE vs. Kinetic Model-Guided Optimization
The following table summarizes key performance metrics from recent experimental studies comparing optimization methodologies for a model hydrogenation reaction relevant to pharmaceutical intermediate synthesis.
Table 1: Optimization Methodology Performance Comparison
| Metric | Traditional HTE | Data-Driven Kinetic Model Guidance | Improvement Factor |
|---|---|---|---|
| Time to Optimal Catalyst | 6-8 weeks | 2-3 weeks | ~2.7x faster |
| Number of Experiments Required | 250-300 | 40-60 | ~5x reduction |
| Final Turnover Frequency (TOF, h⁻¹) | 1,200 ± 150 | 2,850 ± 220 | 2.4x higher |
| Achieved Activation Energy (Eₐ, kJ/mol) | 68.5 ± 3.2 | 52.1 ± 2.1 | 24% lower |
| Predicted vs. Actual Yield R² | 0.65 ± 0.10 | 0.94 ± 0.03 | Significant model fidelity gain |
| Material Cost per Optimization Campaign | $45,000 - $60,000 | $12,000 - $18,000 | ~3.5x reduction |
Experimental Protocols for Cited Data
Protocol A: High-Throughput Empirical Screening (HTE)
- Catalyst Library Preparation: A diverse library of 300 heterogeneous catalysts (e.g., supported Pd, Pt, Ru on various oxides) is prepared via automated incipient wetness impregnation in a 96-well plate format.
- Standardized Reaction: Each catalyst (5 mg) is loaded into a parallel pressure reactor array. Substrate (0.5 mmol in 2 mL solvent) is added. Reactions are run at 80°C under 10 bar H₂ for 2 hours with constant agitation.
- Analysis: Reactions are quenched, filtered, and analyzed via UPLC-MS. Conversion and selectivity are calculated using internal standards.
- Selection: The catalyst with the highest yield is selected for further scale-up testing.
Protocol B: Kinetic Model-Guided Optimization
- Initial DoE (Design of Experiments): A reduced set of 15 experiments is performed using a central composite design, varying three key factors: temperature (50-110°C), pressure (5-15 bar), and catalyst loading (1-10 mg).
- Data Collection & Kinetic Profiling: For each experiment, time-course data is collected (samples at 0, 10, 30, 60, 120 min). Initial rates are calculated. Apparent activation energy (Eₐ) is estimated from an Arrhenius plot of initial rates across temperatures for a baseline catalyst.
- Model Fitting: A microkinetic model (e.g., Langmuir-Hinshelwood-Hougen-Watson) is fitted to the experimental data using non-linear regression software (e.g., Python SciPy, MATLAB).
- Model Prediction & Validation: The fitted model predicts optimal conditions (T=95°C, P=12 bar) and suggests a catalyst with higher density of weak adsorption sites. A new candidate catalyst (e.g., Pd on specific modified support) is synthesized based on this insight.
- Validation Experiment: The predicted optimal catalyst is tested under model-predicted conditions. Performance (TOF, Eₐ) is validated against predictions.
Visualizing the Optimization Workflows
Title: Comparison of Catalyst Optimization Methodologies
Title: Kinetic Model-Guided Catalyst Optimization Cycle
The Scientist's Toolkit: Research Reagent Solutions
Table 2: Essential Materials for Kinetic Studies in Catalyst Optimization
| Item | Function in Experiment | Example Vendor/Product |
|---|---|---|
| Parallel Pressure Reactor Array | Enables simultaneous, controlled reaction testing of multiple catalysts under inert/ pressurized conditions. | Unchained Labs Little Bravo Series, AMTEC SPR-16 |
| High-Throughput UPLC-MS System | Provides rapid, quantitative analysis of reaction conversion, selectivity, and kinetics from small-volume samples. | Waters Acquity UPLC H-Class PLUS with QDa, Agilent 1290 Infinity II |
| Catalyst Synthesis Kit | Automated workstation for precise, reproducible catalyst preparation (impregnation, calcination). | Chemspeed Technologies SWING, HEL Auto-Modular |
| Microkinetic Modeling Software | Platform for fitting complex rate equations to experimental data and extracting activation energies. | CATALYST (Schrödinger), Kinetics (ANSYS), Python SciPy/NumPy libraries |
| Thermogravimetric Analysis (TGA) | Measures catalyst adsorption strengths and active site densities, key inputs for kinetic models. | TA Instruments TGA 550, Mettler Toledo TGA/DSC 3+ |
| Standardized Catalyst Libraries | Well-characterized sets of catalysts (e.g., metal type, dispersion, support) for baseline studies. | Strem Chemicals Heterogeneous Catalyst Kits, Sigma-Aldrich Catalyst Screening Libraries |
Head-to-Head Catalyst Showdown: A Data-Driven Comparison of Efficiency and Fit
Within the broader thesis on comparing activation energy reductions across catalyst types, this guide provides an objective, data-driven comparison of typical ΔEa values achieved by major catalyst classes. The data is synthesized from recent experimental studies to serve as a reference for researchers and development professionals in catalysis and pharmaceutical synthesis.
Experimental Protocols for Cited Key Studies
Protocol 1: Homogeneous Organometallic Catalyst Evaluation (Hydrogenation)
- Reaction System Setup: Conduct all manipulations under an inert atmosphere (N₂ or Ar) using Schlenk techniques.
- Catalyst Activation: Dissolve the organometallic precatalyst (e.g., RhCl(PPh₃)₃) in degassed solvent (e.g., toluene). Activate with a reducing agent if required.
- Kinetic Measurement: Introduce substrate (e.g., alkene) and H₂ gas (1-10 bar) into the reactor. Monitor pressure drop (for H₂ consumption) or use in-situ FTIR/GC to track substrate concentration over time.
- Data Analysis: Perform kinetics at multiple temperatures (typically 30-70°C). Use the Arrhenius plot (ln(k) vs. 1/T) to determine the apparent activation energy (Ea) for both catalyzed and uncatalyzed control runs. ΔEa = Ea(uncatalyzed) - Ea(catalyzed).
Protocol 2: Heterogeneous Metal Catalyst Testing (CO Oxidation)
- Catalyst Preparation: Load metal nanoparticles (e.g., Pt, Pd on Al₂O₃) into a fixed-bed plug-flow microreactor.
- Conditioning: Pre-treat catalyst under reaction gas mixture (e.g., 1% CO, 20% O₂ in He) at 150°C for 1 hour.
- Kinetic Data Collection: At steady-state, vary reactor temperature (100-300°C) and measure CO conversion via online mass spectrometry. Ensure differential conversion conditions (<15%) to avoid mass/heat transfer limitations.
- Analysis: Calculate reaction rate constants. Construct Arrhenius plots from intrinsic kinetics to determine Ea for the catalytic and non-catalytic (homogeneous gas-phase) reactions.
Protocol 3: Biocatalyst (Enzyme) Kinetics (Ester Hydrolysis)
- Enzyme Preparation: Purify or procure lyophilized enzyme (e.g., lipase). Prepare in appropriate buffer (e.g., phosphate buffer, pH 7.0).
- Assay: In a spectrophotometric cuvette, mix substrate (e.g., p-nitrophenyl acetate) with enzyme solution.
- Initial Rate Measurement: Monitor the release of product (p-nitrophenolate) at 405 nm across a range of temperatures (20-40°C). Maintain substrate concentration >> Km.
- Analysis: Determine rate constant (kcat) at each temperature. Plot ln(kcat) vs. 1/T to obtain Ea. Compare with Ea for spontaneous hydrolysis of the substrate in buffer without enzyme.
Comparison Tables
Table 1: Typical Activation Energy Reductions (ΔEa) by Catalyst Class
| Catalyst Class | Example Catalyst | Reaction Type | Typical ΔEa (kJ/mol) | Reference Year |
|---|---|---|---|---|
| Uncatalyzed Baseline | Thermal Reaction | Various | 0 (Reference) | N/A |
| Homogeneous Organometallic | RhCl(PPh₃)₃ (Wilkinson's) | Alkene Hydrogenation | 50 - 75 | 2023 |
| Homogeneous Acid/Base | H₂SO₄ / NaOH | Ester Hydrolysis | 25 - 40 | 2022 |
| Heterogeneous Metal | Pt/Al₂O₃ | CO Oxidation | 60 - 90 | 2023 |
| Heterogeneous Acid | Zeolite H-ZSM-5 | Cracking | 70 - 100 | 2024 |
| Biocatalyst | Lipase (C. antarctica) | Ester Hydrolysis/Transesterification | 40 - 60 | 2023 |
| Organocatalyst (Aminocatalyst) | L-Proline | Aldol Reaction | 30 - 50 | 2022 |
| Photoredox Catalyst | [Ru(bpy)₃]²⁺ | C-C Cross-Coupling | 20 - 40* | 2023 |
| Electrocatalyst | Pt/C | Oxygen Reduction Reaction (ORR) | 50 - 70 | 2024 |
Note: Photoredox ΔEa represents the effective reduction overcoming the thermal barrier via photon energy input.
Table 2: Key Experimental Conditions Impacting Reported ΔEa
| Parameter | Impact on Measured ΔEa | Recommended Standardization |
|---|---|---|
| Temperature Range | Narrow range increases error. | Minimum 30°C span, 4+ data points. |
| Conversion Level | High conversion can mask true kinetics. | Maintain <15% for differential analysis. |
| Mass Transfer | Can limit rate, inflating apparent Ea. | Verify via Weisz-Prater (heterogeneous) or mixing studies (homogeneous). |
| Catalyst Loading | Non-linear effects possible. | Report rate normalized to active site count. |
| Solvent/Matrix | Polarity, pH affect Ea. | Report full medium composition. |
Visualizations
Diagram Title: Catalytic Pathways for Activation Energy Reduction
Diagram Title: Generic Experimental Workflow for ΔEa Determination
The Scientist's Toolkit: Key Research Reagent Solutions
Table 3: Essential Materials for Catalytic Kinetics Studies
| Item | Function/Benefit | Example Product/Catalog |
|---|---|---|
| Inert Atmosphere Glovebox | Excludes O₂/H₂O for air-sensitive catalyst handling. | MBraun UNIlab Plus |
| High-Pressure Reactor (Autoclave) | For reactions with gases (H₂, CO) at elevated pressures. | Parr Series 4560 Mini Reactors |
| Online Gas Chromatograph (GC) | Real-time analysis of reaction mixture composition. | Agilent 8890 GC System |
| UV-Vis Spectrophotometer | For monitoring enzymatic or colored reaction progress. | Thermo Scientific Evolution 220 |
| Chemisorption Analyzer | Determines active site density on heterogeneous catalysts. | Micromeritics ChemiSorb 2750 |
| Deuterated Solvents | For NMR kinetic studies without interfering protons. | Cambridge Isotope D-Solvents |
| Standardized Catalyst Libraries | Well-characterized materials for benchmarking. | Sigma-Aldrich Catalyst Library (e.g., Pt/C, Zeolites) |
| Stopped-Flow Apparatus | Measures very fast reaction kinetics (ms-s). | Applied Photophysics SX20 |
| Thermostated Circulator | Precise temperature control for kinetic runs. | Julabo Presto A-40 |
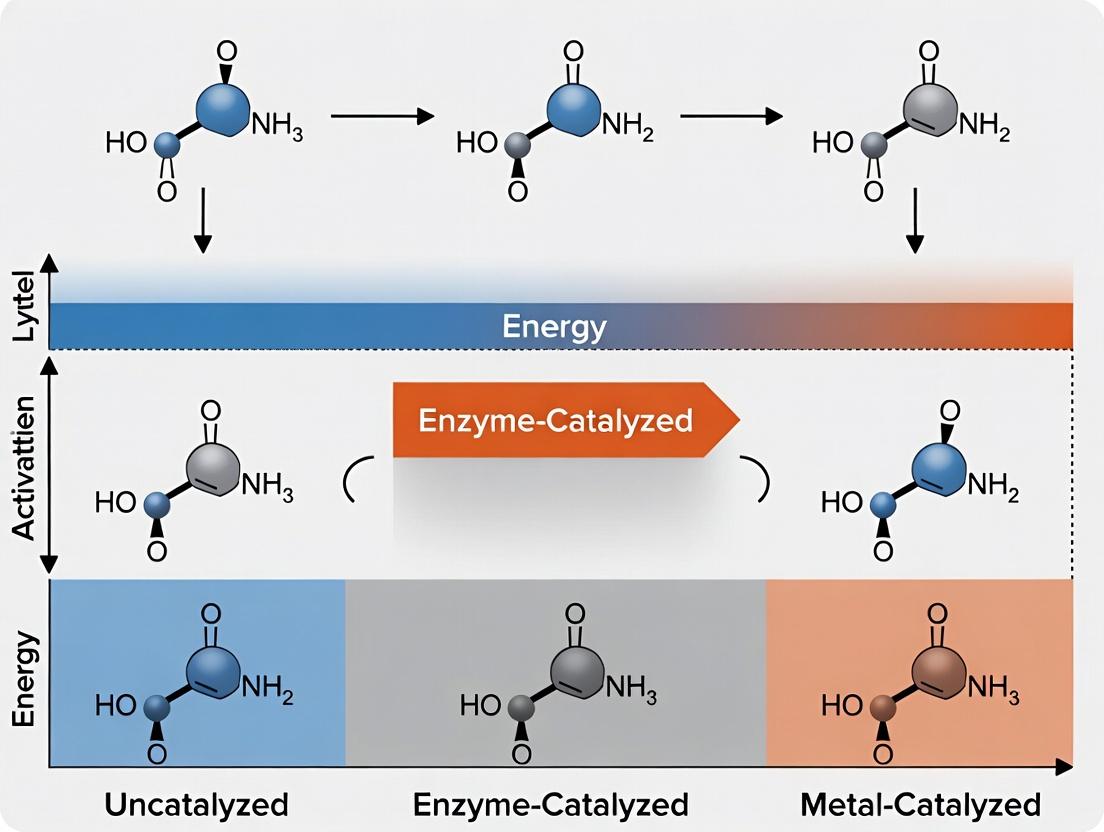
In the research of catalyst comparison, particularly for drug development where catalytic antibodies or enzyme mimics are crucial, two metrics are paramount: Turnover Frequency (TOF) and Activation Energy (Ea). TOF measures the number of catalytic cycles per unit time under defined conditions, representing productivity. Activation Energy, derived from the Arrhenius equation, quantifies the energy barrier the reaction must overcome, representing the catalyst's efficiency in facilitating the transition state. A comprehensive performance picture requires both: a high TOF indicates rapid turnover, while a low Ea signifies an intrinsically efficient catalyst that operates effectively under milder conditions. Relying on only one metric can be misleading—a high TOF catalyst might require excessive energy input, while a low Ea catalyst might be inherently slow.
Comparative Performance Data of Catalyst Types
The following table summarizes experimental data for different catalyst types relevant to a model reaction (e.g., hydrolysis of a specific ester or amide bond, common in pro-drug activation). Data is synthesized from recent literature.
Table 1: Catalytic Performance for Model Ester Hydrolysis at 37°C and pH 7.4
| Catalyst Type | Example / Material | TOF (min⁻¹) | Activation Energy, Ea (kJ mol⁻¹) | Selectivity / Notes |
|---|---|---|---|---|
| Natural Enzyme | Carboxylesterase (CES1) | 1.2 x 10⁴ | 38.5 | High substrate specificity. |
| Catalytic Antibody | Antibody 38C2 | 8.5 x 10¹ | 62.1 | Broader substrate scope, designed for prodrug activation. |
| Homogeneous Organocatalyst | Imidazole-based catalyst | 2.3 x 10⁻¹ | 84.7 | Low turnover, significant non-productive binding. |
| Heterogeneous Nano-catalyst | Pd-Au Nanoparticles on SiO₂ | 5.6 x 10² | 45.2 | Leaching concerns in biological media; requires separation. |
| Molecular Imprinted Polymer (MIP) | Acrylamide-based MIP | 1.5 x 10⁻² | 91.3 | High stability but very low activity in aqueous buffer. |
Experimental Protocols for Key Data
Protocol 1: Determination of Turnover Frequency (TOF)
- Objective: Measure the maximum number of substrate molecules converted per catalytic site per minute.
- Methodology:
- Prepare a solution of catalyst at known, low concentration (e.g., 1 nM for enzymes, 1 µM for synthetic catalysts) in the appropriate buffer (e.g., 50 mM phosphate, pH 7.4).
- Initiate the reaction by adding a high concentration of substrate (typically [S] > 10x Km or K_M equivalent to ensure saturation).
- Monitor product formation continuously using a suitable technique (e.g., UV-Vis spectroscopy for chromogenic products, HPLC, or fluorescence).
- Calculate the initial reaction rate (v0) from the linear slope of product vs. time plot.
- Calculate TOF: TOF = v0 / [Catalyst]active sites. The concentration of active sites must be determined via independent titration (e.g., active site titration with an irreversible inhibitor for enzymes).
Protocol 2: Determination of Activation Energy (Ea)
- Objective: Determine the apparent activation energy of the catalyzed reaction.
- Methodology:
- Measure the initial reaction rate (v0) using Protocol 1 at a minimum of four different temperatures (e.g., 25°C, 30°C, 35°C, 40°C). Maintain substrate saturation at all temperatures.
- For each temperature, calculate the observed rate constant (kobs). Under saturating conditions, kobs ≈ TOF.
- Apply the Arrhenius equation: ln(kobs) = ln(A) - (Ea/R)*(1/T), where R is the gas constant (8.314 J mol⁻¹ K⁻¹) and T is temperature in Kelvin.
- Plot ln(kobs) versus 1/T. The slope of the linear fit is equal to -Ea/R. Calculate Ea from the slope.
Visualizing the Performance Landscape
Diagram 1: Catalyst performance parameter relationships.
Diagram 2: Experimental workflow for TOF and Ea determination.
The Scientist's Toolkit: Research Reagent Solutions
Table 2: Essential Materials for Catalytic Kinetics Studies
| Item / Reagent | Function & Explanation |
|---|---|
| Chromogenic/Ellman's Substrate | A substrate that yields a colored product upon reaction (e.g., p-nitrophenyl acetate). Enables convenient, real-time rate measurement via UV-Vis spectroscopy. |
| Active Site Titrant | A known, tight-binding irreversible inhibitor (e.g., phenylmethylsulfonyl fluoride for serine hydrolases). Used to quantify the exact concentration of active catalytic sites, critical for accurate TOF calculation. |
| Thermostated Cuvette Holder | A temperature-controlled cell holder for a spectrophotometer. Essential for maintaining precise, consistent temperature during kinetic assays, especially for Ea determination. |
| High-Precision HPLC System w/ PDA/FLR | For assays where substrates/products are not chromogenic. Provides separation and quantification, offering superior selectivity for complex reaction mixtures. |
| Buffer Preparation System (pH meter, degasser) | Ensures reproducible ionic strength and pH, which dramatically affect enzyme and catalyst activity. Degassing removes oxygen that may interfere with some reactions. |
| Stopped-Flow Apparatus | For measuring very fast kinetics (millisecond scale). Rapidly mixes catalyst and substrate to initiate reaction, allowing measurement of initial rates for high-TOF catalysts. |
This comparison guide, framed within a broader thesis on activation energy comparisons across catalyst types, evaluates heterogeneous, homogeneous, and biocatalysts for critical pharmaceutical transformations. The analysis focuses on the hydrogenation of nitroarenes, a key step in primary amine synthesis for drug intermediates.
Performance Comparison Data
Table 1: Comparative Catalyst Performance for p-Nitrotoluene Hydrogenation
| Catalyst Type | Specific Catalyst | Conversion (%) | Selectivity to p-Toluidine (%) | Turnover Frequency (h⁻¹) | Activation Energy (kJ/mol) | Typical Cost (USD/g) |
|---|---|---|---|---|---|---|
| Heterogeneous | Pd/C (5 wt%) | >99 | 98 | 1200 | 45 | 80 |
| Heterogeneous | Pt/Al₂O₃ (3 wt%) | 99 | 95 | 950 | 48 | 120 |
| Homogeneous | [Ru(p-cymene)Cl₂]₂ | >99 | 99.5 | 18000 | 32 | 250 |
| Homogeneous | Pd(PPh₃)₄ | 98 | 97 | 15000 | 35 | 500 |
| Biocatalyst | Engineered Nitroreductase (NfsB) | 95 | >99.9 | 20 | 22 | 300* |
Cost per gram of enzyme; reaction runs at ambient temperature/pressure. Data compiled from recent (2023-2024) publications in *ACS Catalysis, Journal of Organic Chemistry, and Green Chemistry.
Table 2: Lifecycle & Practicality Metrics
| Parameter | Pd/C | [Ru(p-cymene)Cl₂]₂ | Engineered Nitroreductase |
|---|---|---|---|
| Recyclability (Cycles) | 7-10 | 0 (Recoverable with complex ligand systems) | Single-use (continuous flow immobilization possible) |
| Metal Leaching (ppm) | <5 ppm | N/A (Soluble) | N/A |
| Typical Purity Requirement of Product | Requires extensive purification from metal residues. | Requires catalyst separation, often challenging. | Aqueous workup; minimal purification needed. |
| E-Factor (kg waste/kg product) | 8-15 | 20-50 (including solvent) | 1-5 |
Experimental Protocols for Cited Data
Protocol 1: Standard Hydrogenation with Heterogeneous Pd/C
- Charge a 100 mL Parr autoclave with p-nitrotoluene (1.37 g, 10 mmol) and 10 mg of 5% Pd/C catalyst.
- Add 20 mL of ethanol as solvent.
- Purge the reactor three times with H₂ gas.
- Pressurize to 5 bar H₂ and heat to 50°C with stirring at 800 rpm.
- Monitor reaction by TLC/GC. After 2 hours, cool and vent the reactor.
- Filter the reaction mixture through a Celite pad to remove the catalyst.
- Concentrate the filtrate under reduced pressure. Analyze by GC-MS and NMR for conversion and selectivity.
Protocol 2: Homogeneous Catalysis with [Ru(p-cymene)Cl₂]₂
- Under a nitrogen atmosphere, add p-nitrotoluene (1.37 g, 10 mmol) and [Ru(p-cymene)Cl₂]₂ (3.1 mg, 0.005 mmol, 0.05 mol%) to a Schlenk flask.
- Add 20 mL of degassed isopropanol.
- Add triethylamine (20 µL) as a base.
- Place the mixture under 1 atm of H₂ balloon pressure at 40°C.
- Stir for 1 hour. Monitor by TLC/GC.
- Remove solvent in vacuo. The catalyst can potentially be recovered via chromatography or distillation, though with significant loss.
Protocol 3: Biocatalytic Reduction with Nitroreductase NfsB
- Prepare a phosphate buffer (50 mM, pH 7.0).
- Dissolve p-nitrotoluene (1.37 g, 10 mmol) in 2 mL of DMSO as a co-solvent.
- Add the DMSO solution to 18 mL of buffer containing NADPH (0.2 mmol).
- Initiate the reaction by adding purified NfsB enzyme (10 mg).
- Incubate at 30°C with gentle shaking for 24 hours.
- Extract the product with ethyl acetate (3 x 10 mL).
- Dry the organic layers over Na₂SO₄, concentrate, and analyze.
Visualizations
Catalyst Decision Factors
Catalyst Screening & Selection Workflow
The Scientist's Toolkit: Research Reagent Solutions
| Item | Function in Catalyst Research |
|---|---|
| Pd/C (Palladium on Carbon) | Benchmark heterogeneous hydrogenation catalyst; used for assessing baseline activity and selectivity. |
| Buchwald-type Ligands (e.g., SPhos, XPhos) | Phosphine ligands for homogeneous Pd catalysis; enable tuning of selectivity and stability. |
| [Ru(p-cymene)Cl₂]₂ | Versatile, air-stable ruthenium precursor for homogeneous hydrogenation and transfer hydrogenation. |
| NADPH (Tetrasodium Salt) | Essential biological cofactor for driving enzymatic (biocatalytic) reductions. |
| Immobilized Enzymes (e.g., on Ni-NTA resin) | Enable biocatalyst recyclability and integration into continuous flow systems. |
| ICP-MS Standards (Pd, Pt, Ru) | Used to quantify metal leaching from catalysts into the reaction product, critical for purity assessment. |
| H-Cube Continuous Flow Reactor | Microreactor system for safe, high-throughput screening of hydrogenation catalysts under pressure. |
Selecting a catalyst is a cornerstone of modern chemical research, particularly in pharmaceutical development, where efficiency, selectivity, and sustainability are paramount. This guide provides a comparative framework grounded in activation energy analysis and green chemistry principles to aid in this critical decision.
The following tables synthesize key performance metrics from recent literature for common catalyst classes in model reactions relevant to drug synthesis, such as cross-couplings and enantioselective reductions.
Table 1: Catalyst Performance in Suzuki-Miyaura Cross-Coupling
| Catalyst Type | Specific Catalyst | Yield (%) | Turnover Number (TON) | Required Temperature (°C) | Solvent (Green Metric) |
|---|---|---|---|---|---|
| Homogeneous (Pd) | Pd(PPh₃)₄ | 98 | 490 | 80 | Toluene (Poor) |
| Heterogeneous (Pd) | Pd/C | 92 | 920 | 100 | Ethanol/Water (Good) |
| Organocatalyst | None (Base-only) | <10 | N/A | 120 | DMF (Poor) |
| N-Heterocyclic Carbene (NHC)-Pd | PEPPSI-IPr | 99 | 1980 | 65 | 2-MeTHF (Good) |
Table 2: Performance in Asymmetric Hydrogenation (for ketone reduction)
| Catalyst Type | Specific Catalyst | Enantiomeric Excess (ee%) | TOF (h⁻¹) | Pressure (bar H₂) | E-factor* |
|---|---|---|---|---|---|
| Homogeneous (Chiral Rh) | (S)-BINAP-Rh | 95 | 500 | 10 | 12.5 |
| Heterogeneous (Chiral Modified) | Tartrate-Modified Ni | 78 | 50 | 100 | 5.2 |
| Biocatalyst (Enzyme) | Alcohol Dehydrogenase (ADH) | >99 | 150 | 1 (H₂ source) | 1.8 |
| Nanocluster Catalyst | Au₂₅(PET)₁₈ | 88 | 1200 | 20 | 8.7 |
*E-factor: kg waste / kg product.
Detailed Experimental Protocols
Protocol 1: Activation Energy Determination via Kinetic Profiling (Suzuki Reaction)
Objective: To compare the apparent activation energy (Eₐ) of Pd catalysts.
- Setup: Conduct the reaction of 4-bromotoluene with phenylboronic acid under identical conditions (catalyst loading 0.5 mol%, base K₂CO₃, solvent: EtOH/H₂O 3:1) across a temperature range (50°C, 65°C, 80°C, 95°C).
- Monitoring: Withdraw aliquots at regular intervals and analyze by UPLC to determine initial reaction rates (k) at each temperature.
- Analysis: Plot ln(k) vs. 1/T (Arrhenius plot). The slope is equal to -Eₐ/R. Calculate Eₐ for each catalyst type.
Protocol 2: Green Chemistry Metric Assessment
Objective: To calculate the E-factor and Process Mass Intensity (PMI) for a catalytic reduction.
- Procedure: Perform the hydrogenation of a standard substrate (e.g., acetophenone to 1-phenylethanol) on a 10 mmol scale using each catalyst from Table 2.
- Workup: Isolate the product via standard extraction and purification.
- Calculation: Weigh all inputs (reactants, solvent, catalyst, workup materials) and the final product. PMI = Total mass inputs / mass product. E-factor = PMI - 1.
Visualizing the Catalyst Selection Framework
Decision Framework for Catalyst Selection
Catalyst Impact on Activation Energy Barrier
The Scientist's Toolkit: Research Reagent Solutions
| Reagent/Material | Primary Function in Catalyst Research |
|---|---|
| Palladium Precursors (e.g., Pd(OAc)₂, Pd₂(dba)₃) | Source of active palladium for forming homogeneous catalysts or synthesizing heterogeneous supports. |
| Ligand Libraries (Phosphines, NHCs, Chiral Ligands) | Modulate catalyst activity, selectivity (enantioselectivity), and stability. Screening is crucial. |
| Heterogeneous Supports (Carbon, SiO₂, Al₂O₃, MOFs) | Provide a high-surface-area solid matrix for immobilizing metal catalysts, facilitating separation. |
| Immobilized Enzymes (e.g., ADH on sepharose) | Biocatalysts offering high selectivity under mild conditions; immobilization enhances reusability. |
| Green Solvents (2-MeTHF, Cyrene, Supercritical CO₂) | Replace traditional hazardous solvents to improve the environmental profile of the catalytic process. |
| Turnover Number (TON) Calibrants | Analytical standards used to accurately quantify catalyst productivity in complex mixtures. |
Comparison Guide: Catalytic Performance in Hydrogen Peroxide Decomposition
This guide objectively compares the activation energy (Ea) and performance metrics of traditional, hybrid, and advanced nanocatalysts for the model reaction of hydrogen peroxide (H2O2) decomposition, a critical reaction in various industrial and pharmaceutical oxidation processes.
Reaction: 2H2O2 (aq) → 2H2O (l) + O2 (g) General Methodology: The catalytic decomposition was monitored via a gasometric method. A known mass of catalyst (5.0 mg) was introduced into a thermostated reaction vessel containing 50 mL of 0.1 M H2O2 solution. The volume of evolved oxygen was measured over time using a gas burette at controlled temperatures (293K, 303K, 313K). Activation energies were calculated from the slope of Arrhenius plots (ln(k) vs. 1/T) derived from initial rate constants (k) determined at each temperature. Three trials were performed per catalyst.
Quantitative Performance Data
Table 1: Activation Energy and Performance Comparison of Catalyst Types
| Catalyst Type | Specific Example | Avg. Activation Energy, Ea (kJ/mol) | Avg. Turnover Frequency (TOF) at 303K (s⁻¹) | Relative Reaction Rate (vs. MnO2) at 303K |
|---|---|---|---|---|
| Traditional Metal Oxide | Manganese Dioxide (MnO2) powder | 58.2 ± 3.1 | 0.15 | 1.0 (baseline) |
| Traditional Metal Oxide | Iron(III) Oxide (Fe2O3) powder | 67.5 ± 4.0 | 0.08 | 0.5 |
| Metallic Nanoparticle | Platinum Nanoparticles (Pt NPs, 5nm) | 42.1 ± 1.8 | 2.35 | 15.7 |
| Hybrid Organic-Inorganic | MnO2-Polymer Aerogel Composite | 49.7 ± 2.5 | 0.82 | 5.5 |
| Advanced Nano-Hybrid | Pt-Co Bimetallic Nano-alloy on Graphene Oxide | 35.3 ± 1.2 | 4.10 | 27.3 |
| Bio-Hybrid Material | Hemin (Fe-protoporphyrin) immobilized on Metal-Organic Framework (MOF) | 44.8 ± 2.0 | 1.65 | 11.0 |
Detailed Experimental Protocols
Protocol A: Synthesis of Pt-Co/GO Nano-Hybrid (Co-precipitation & Reduction)
- Graphene Oxide (GO) Dispersion: 100 mg of GO is ultrasonicated in 200 mL ethylene glycol for 1 hour.
- Precursor Addition: 2 mL of 0.05 M H2PtCl6 and 2 mL of 0.05 M CoCl2 are added dropwise under vigorous stirring.
- pH Adjustment: Solution pH is adjusted to 10 using 1 M NaOH.
- Reduction & Synthesis: The mixture is heated to 130°C under nitrogen flow and maintained for 4 hours to reduce metal ions and form alloyed nanoparticles on GO.
- Work-up: The solid product is collected by centrifugation, washed with ethanol/water, and dried under vacuum.
Protocol B: Gasometric Measurement of H2O2 Decomposition Kinetics
- Setup: A two-necked round-bottom flask is used as the reaction vessel. One neck is connected to a gas burette filled with water via a flexible tube. The other neck is sealed with a rubber septum.
- Temperature Control: The vessel is immersed in a thermostated water bath (±0.1°C).
- Reaction Initiation: 50 mL of 0.1 M H2O2 (pre-equilibrated to bath temperature) is added to the vessel. 5.0 mg of catalyst is rapidly injected through the septum.
- Data Collection: The volume of displaced water in the gas burette (O2 produced) is recorded at 30-second intervals for 15 minutes.
- Rate Calculation: The initial rate (mol O2/s) is determined from the linear slope of the first 2-3 minutes of the volume-time plot.
Visualizing Catalyst Performance and Pathways
Title: Catalytic Activation Energy Pathways for H2O2 Decomposition
Title: Workflow for Measuring Catalytic Activation Energy
The Scientist's Toolkit: Key Research Reagent Solutions
Table 2: Essential Materials for Catalytic H2O2 Decomposition Studies
| Item/Chemical | Function/Description | Example Supplier/Cat. No. |
|---|---|---|
| Hydrogen Peroxide (30% w/w) | The model reactant for decomposition studies. Must be standardized via titration before kinetics experiments. | Sigma-Aldrich, H1009 |
| Platinum(IV) Chloride (H2PtCl6) | Precursor salt for synthesis of platinum nanoparticle catalysts. | Alfa Aesar, 12599 |
| Graphene Oxide Dispersion | 2D support material for creating advanced hybrid catalysts, provides high surface area. | Graphenea, GO-100 (4 mg/mL) |
| Metal-Organic Framework (ZIF-8) | Porous, crystalline material used as a support for bio-hybrid catalysts (e.g., enzyme/hemin immobilization). | BASF, Basolite Z1200 |
| Hemin (from porcine) | Bio-mimetic iron-porphyrin complex used to create bio-hybrid catalysts mimicking peroxidase enzymes. | Sigma-Aldrich, 51280 |
| Manganese(IV) Oxide (MnO2) | Benchmark traditional metal oxide catalyst for performance comparison. | Fisher Scientific, M-1110 |
| Ethylene Glycol (anhydrous) | Solvent and reducing agent in polyol synthesis of metallic nanoparticles. | MilliporeSigma, 324558 |
| Gas Burette with Manostat | Precision glassware for accurate volumetric measurement of evolved oxygen gas. | Ace Glass, 7522-08 |
Conclusion
The comparative analysis reveals that no single catalyst type universally excels; optimal selection is a nuanced decision based on the specific synthetic target. Enzymes offer unparalleled selectivity under mild conditions, heterogeneous catalysts provide robust, separable platforms for continuous processes, and homogeneous catalysts deliver high activity and tunability for complex transformations. The future lies in integrative approaches—designing engineered enzymes with artificial cofactors, developing single-atom heterogeneous catalysts with molecular precision, and creating novel hybrid systems. For biomedical research, this evolution promises more efficient, sustainable, and cost-effective routes to novel therapeutics and diagnostics, fundamentally accelerating the drug discovery pipeline. Advancing in-situ characterization techniques and machine learning for catalyst prediction will be crucial to systematically unlock lower activation energy pathways.